
Analytics & Reporting
Understand your environment. Advocate for your collection.
Conserv turns environmental data into preservation insights, with out-of-the-box metrics, automated reports, and interactive visualizations that make your data useful to everyone on your team.
FROM READINGS TO DECISIONS
Data you can act on
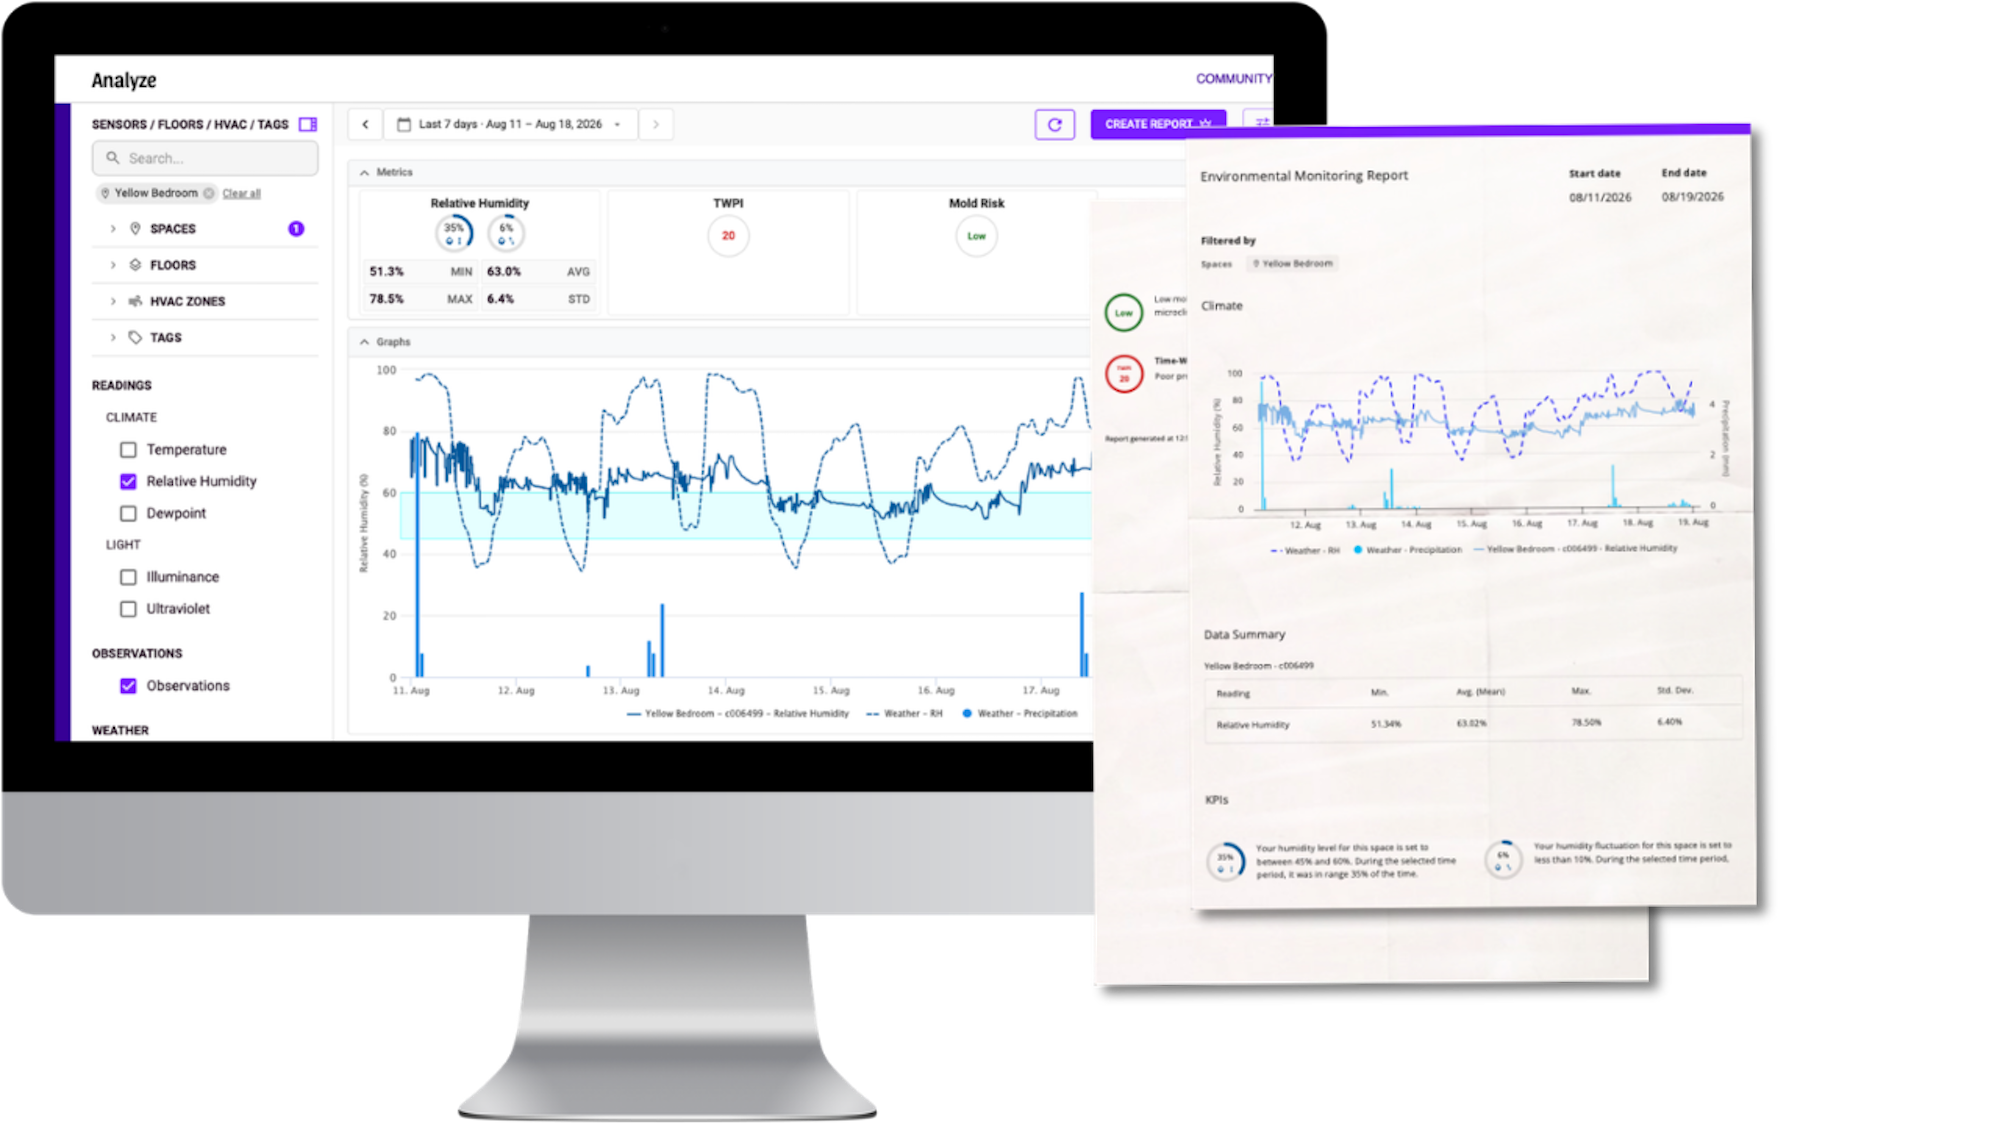
Raw temperature and humidity readings don’t tell you whether your collection is at risk. Conserv’s analytics interprets your data in real time, flagging concerning conditions, surfacing trends before they become problems, and generating the reports your stakeholders need.
Everything you need to monitor, understand, and report.
See everything, in context.
Sensor readings are available in real time and accessible from anywhere. But readings alone aren’t enough. Conserv layers in outdoor weather and precipitation data so you can see exactly how exterior conditions affect your indoor environment. When a humidity spike appears on a Monday morning, you’ll know whether it was the weekend’s rainstorm or a failing HVAC unit.
Interactive live data graphs
Temperature, RH, dewpoint, light, and UV for every sensor, updated continuously and viewable across any time range.
Outdoor weather and precipitation
Track history with observations

“Real-time alerts about temperature and humidity have made it so much easier to build our understanding of how our building interacts with the exterior environment.”
Dara Lohnes-Davies – Collections Manager, University of Wyoming Art Museum

Understand what it means for your collection.
Conserv calculates preservation metrics — including 24-hour fluctuation, mold risk, and TWPI — out of the box, translating readings into a common language that can help you communicate with colleagues, leadership, and external stakeholders.
Compare to your targets
Preservation metrics
Risk–focused graphs
“Conserv really makes people’s lives much easier… It’s very visual and graphic so people understand much better.”
Mariateresa Pullano – Paper Conservator, Gothenburg Museum of Art
Share it with the people who need it.
Conserv makes it easy to get the right information to the right people — whether that’s a scheduled monthly report for your director, a facility report for a lending institution, or an annual building performance summary for a grant application.
One-click loan and performance reports
Scheduled reports
Set up automated report delivery and choose who receives them. Your director gets the summary they need without you running it manually each time.
Custom reports

“Conserv has been monumental in collecting the data we need to stay under the energy restrictions the government set for our museum. We came in under the limit and were even congratulated for it!”
Anna-Maria Royal – Senior Registrar, Museum of the Bible
See all of your monitoring data in one place.
Years of environmental records are institutional knowledge. Conserv imports historical data from legacy systems and CSV files, so your full monitoring history lives in one place — available for reports, trend analysis, and grant documentation.
PEM2
HOBO
Hanwell
Testo
CSV
Getting More From Your Environmental Data
Did you know that Conserv’s environmental monitoring software can be incredibly helpful for preventive conservation, even if you don’t use Conserv sensors?
Taking measurements throughout your environment, using spreadsheets to store and track your data, and then manually selecting that data to compare results can be an incredibly long process. But what if you could simplify it?
Find out from Josefa Orrego Trincado what it’s like using Conserv’s environmental monitoring software to create a single, centralized place where all the environmental data ever collected in the museum is stored, visualized, and analyzed with just a couple of clicks.
Your environmental data, where your collection lives.
Environmental data shouldn’t sit in a silo. Conserv connects with your collections management system, so temperature, humidity, and climate trends appear right alongside your object records — giving your team the full picture in one place. We’ve partnered with Collector Systems to bring live environmental data into their platform, and our public API means other collections management systems can connect to Conserv too.
Collector Systems integration
Public API
Connect Conserv to the other systems your institution relies on. Our public API makes your environmental data available wherever your team works.

All your preventive conservation work on one platform.
Conserv includes integrated pest management (IPM) tools alongside your environmental data, so you’re not managing two separate systems. Track pest monitors, log observations, and identify pests against the MuseumPests.net database — all in the same platform where your sensor data lives.
Reference images from MuseumPests.net
Pest monitor tracking
Out-of-the-box IPM reporting
“The customer service is impeccable. Prompt response and clear solutions. Our staff uses the IPM features, and it makes all the difference that we can share and report from any of our buildings.”
McLaren Cundiff – Senior Registrar, Minnesota Street Art Services
Your collection, in your pocket.
The free Conserv mobile app gives you real-time access to your environmental data from anywhere. Check in on a space remotely, perform range tests, download sensor data, or log an observation while you’re on the floor. Available on iOS and Android.


Know the moment something changes
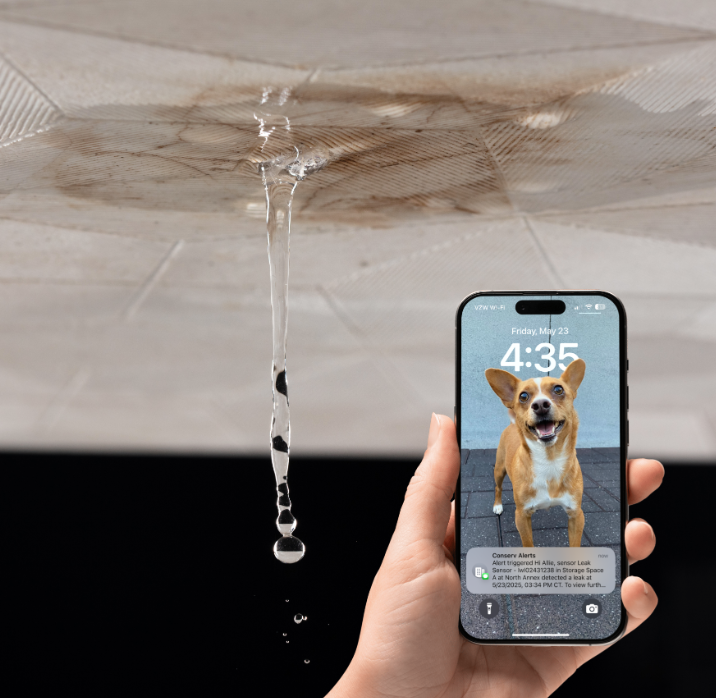
Analytics tell you what happened. Alerts tell you when to act. Conserv watches your environment around the clock and notifies the right people the moment something changes, so your team can respond before damage occurs.
Real-time SMS and email alerts — Get notified the moment a condition crosses the line, by text or email, wherever you are.
Custom ranges — Set the acceptable temperature and humidity ranges that matter for each space and collection, and let Conserv watch them for you.
Choose who gets notified — Send the right alerts to the right people, so the person who can act is the one who hears about it.
Webhooks for custom workflows — Connect alerts to the tools your team already uses, like Slack or Teams, or build your own custom notification workflows.
Case Study
Visibility in the storm
When a hurricane knocked out power across New Orleans, Toni Kiser was at home without electricity herself. But she could still see inside the museum.
Using the Conserv mobile app, she monitored conditions across collection spaces remotely — telling on-site staff when to hold and when to bring in dehumidifiers and generators, before heat and humidity could threaten a collection of 250,000 objects.
“I didn’t need facilities to go in and tell me what the temperature and humidity were — I could see it from my house.”
Toni Kiser, Director of Collections Management, National WWII Museum
Trusted by the institutions setting the standard for collections care






See your data come to life.
Our team of preservation professionals will walk you through Conserv’s analytics with your institution’s specific spaces and collection needs in mind.