What is environmental data?
Environmental data is any organized information that is gathered about the environment in which an object or artwork is stored, handled, or displayed. Such data is gathered to inform decisions, address problems, or answer questions. In most cases, the data is connected to one of the Agents of Deterioration.
While monitoring should be done for all relevant agents, collections most often gather data about temperature (degrees), relative humidity (%) and light (lux).
Temperature and relative humidity data can be gathered easily and inexpensively.
Specific, accurate data provides a basis on which practical temperature and relative humidity goals can be set that consider the limitations of existing systems. Environmental data shows if current climate control is inadequate and the severity of an existing problem. It allows you to evaluate the effect of any changes that you make.
Other important environmental data that you can gather easily and inexpensively is information about pest activity. If you are in an earthquake-prone area or near construction, data on vibration may also be important.
Why do we collect environmental data?
Environmental data helps identify how your building may influence your collections. It enables you to make informed decisions about how to improve environmental conditions and improve the long-term preservation of your collection. (Several were discussed in a previous blog.)
There are overarching reasons, such as understanding your building and knowing your collections environment.
Museum activities, such as obtaining loans for exhibit, may also require you to collect specific data to show that the lender can trust that their loaned object will be preserved at your institution.
Other specific data can provide information on whether a case or cabinet that is supposed to mitigate changes in temperature and humidity actually does. In all these cases, you are collecting data to make better decisions or to help others, such as lenders, make informed decisions.
Collecting environmental data
Environmental data can be gathered in many ways with different types of instruments. The way in which you collect data will depend mainly on your budget, your staffing, and the reasons why you are collecting the data. These all need to be balanced and planned before you begin collecting the data. Figuring out where to collect data is also an essential part of your plan.
It is helpful to create a map showing exactly where you are gathering what types of data: loggers, traps, etc.
Data can be collected manually or automatically and by spot-checking or continuously. The loggers might be standalone or networked. The data might need to be manually downloaded, or it may be gathered wirelessly. Manual gathering and non-networked loggers generally require more staff time, but they may be less expensive. You might gather data every minute, every 15 minutes, or every hour. Even if the data is gathered automatically, make sure there is a set schedule for analyzing that data.
In general, you need a full year’s worth of data to give a complete picture of the environmental conditions.

Analyzing
Your raw data can be formatted in different ways for analyzing. The way you choose depends on the questions you are asking and the reasons you are collecting the data. The two simplest formats to create are tables and graphs. The raw data will consist of the measured data, the time it was measured, and where it was measured:
| Rm 6D | Date | Time | RH (%) |
| 2/7/2023 0:00 | 12:00:00 AM | 44.3 | |
| 2/7/2023 0:00 | 12:15:00 AM | 44.5 | |
| 2/7/2023 0:00 | 12:30:00 AM | 45.3 | |
| 2/7/2023 0:00 | 12:45:00 AM | 45.7 | |
| 2/7/2023 0:00 | 1:00:00 AM | 45.7 | |
| 2/7/2023 0:00 | 1:15:00 AM | 44.9 | |
| 2/7/2023 0:00 | 1:30:00 AM | 43.7 | |
| 2/7/2023 0:00 | 1:45:00 AM | 42 | |
| 2/7/2023 0:00 | 2:00:00 AM | 39.8 | |
| 2/7/2023 0:00 | 2:15:00 AM | 41 | |
| 2/7/2023 0:00 | 2:30:00 AM | 40.5 |
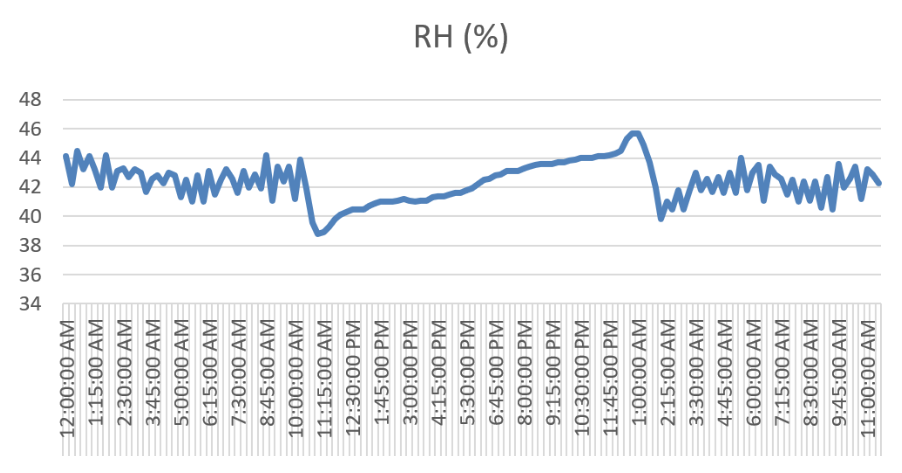
If there is a large amount of data gathered, it can be difficult to analyze in a table form. Most spreadsheet programs can easily turn tabular data into graphs that present things more visually.

- Graph of relative humidity (RH) over time. The horizontal X axis represents reading time and the vertical Y axis shows percentage RH.
Beyond basic analysis
There are more complex ways to analyze and present the data, such as preservation metrics or evaluations. These combine different factors and data to give an overall view of the risk to collections in the given environment. They can indicate the risk of mold growing or metal corroding.
Some software can provide a score or grade that may be more useful for presentation to administrators or others.
For example, it’s possible to create a metric that will tell you how much more damage is happening to your collection than if you were meeting your temperature, humidity, and light level targets. Data is your non-partial witness.
Interpreting
Interpreting your data can go directly back to the questions that caused you to gather the data. But it can also lead to larger conclusions. Are there trends that you were unaware of? For example, does the data show that the HVAC system runs differently overnight than while the building is occupied during the day?
Is there a difference between summer and winter? Are your problems localized to one area or do they affect the whole building?
Interpretation of your data might reveal that your building envelope is not tight because interior conditions match outside conditions very closely. You might find that a cabinet that you thought buffered for temperature and humidity swings does not.
Make your environmental data plan
Accurate environmental data is one of the most important tools in determining whether the conditions you want are being achieved as well as how you might make adjustments and improvements to reach those. The more data the better; but any data is better than none – if you have planned first. Do not gather data just to gather data. There might be multiple suspected issues that need to be addressed, and you may have a small budget and few staff. Pick one question or problem on which you can easily gather relevant data. Plan. Then start gathering data – even if it is only in one place and addresses only one issue.
Hear more from Linda Endersby, Registrar and Collections Manager, in the Conserv Community.
If you have any questions about environmental monitoring, integrated pest management, or just want to talk about preventative conservation, please reach out to us! Don’t forget to check out our blog or join our community of collections care professionals where you can discuss hot topics, connect with other conservators or even take a course to get familiar with the Conserv platform.