")
Introducing our new analytics experience and updated plans
Conserv was built to make environmental monitoring accessible to every institution caring for a collection. We’ve had hundreds of conversations with Conserv users about how they analyze their data, what they wish they could see at a glance, and where they’re spending too much time on repetitive tasks like report generation. Those conversations shaped what we’re launching today.
We’re excited to introduce our brand new analytics experience — and alongside it, an updated set of plans designed to better match the range of institutions we serve.
What’s new in analytics
The new analytics is now the default experience for all Conserv accounts. Whether you’re on our free Essentials plan or our Enterprise plan, you’ll notice a cleaner interface with more flexibility and control. Here’s a rundown of what’s changed.
Exterior weather and precipitation data. You can now overlay local weather conditions directly on your sensor charts, making it easy to see how outdoor conditions are affecting your indoor environment. Weather data is available on all plans. Precipitation data is available on Pro and above.
Fluctuation chart. A new chart type that visualizes how much your temperature and humidity fluctuate within a rolling 24-hour period, plotted against your set thresholds. This makes it much easier to spot patterns of instability that a standard time-series chart might not reveal.
Preservation metrics. The Image Permanence Institute’s TWPI (Time Weighted Preservation Index) and Mold Risk indicators are now available alongside our time-in-range and fluctuation metrics, giving you a more complete picture of how your environment is affecting your collection at a glance.
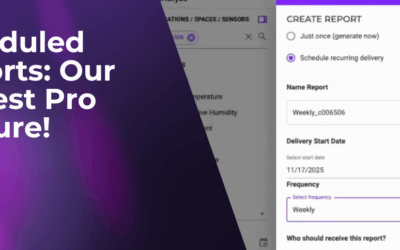
Scheduled reports. You can now automate recurring PDF report delivery to stakeholders on a daily, weekly, or monthly basis. No more manually pulling and emailing the same report over and over again!
Full customization. Control your axis ranges, toggle individual chart components on or off, and choose how your levels are displayed. The analytics experience now adapts to the way you want to work, not the other way around.
Updated plans
Alongside the new analytics, we’re updating our plans to better serve institutions at every stage of their environmental monitoring journey.
When we first launched Conserv Cloud, we kept things simple: a free plan designed to be an entry point to environmental monitoring, and our subscription plan with Conserv-managed devices. As our user base has grown, so has the range of what people need. Some institutions have significant numbers of data loggers and need more advanced analysis tools, but aren’t yet ready for a fully managed monitoring solution. We didn’t have a great option for them — until now.
Here’s how our plans now work:
Essentials (free) is our entry point for institutions using manual data loggers. It includes the Conserv web and mobile apps, standard graphs and reports, exterior weather data, IPM for up to 50 pest traps, and unlimited data storage and users.
Pro is our new plan, designed for institutions that want deeper insights from their data. It includes everything in Essentials, plus advanced graphs (like the new fluctuation chart), preservation metrics and statistics, precipitation data, custom and scheduled reports, larger file and batch imports, unlimited pest traps, custom pest lists, and support from our team of preservation professionals. You can see the full pricing details here.
Complete is for institutions that want the full Conserv experience with managed devices. It includes everything in Pro, plus Conserv-managed sensors, automated data collection, real-time alerts by SMS or email, a full ongoing warranty, and freshly calibrated devices every three years.
Enterprise is for institutions with bespoke requirements, including a dedicated customer success manager, custom onboarding and training, guidance from preservation professionals, multi-site reporting, local data hosting, and custom contract terms.
You can compare all features across plans on our pricing page.
What this means for you
If you’re on our current Free plan, your account has already been upgraded to the new analytics experience at no cost. You’ll continue to have access to standard graphs, reports, weather data, and everything else in the Essentials plan.
And as an added bonus, we are temporarily upgrading all users to the Pro plan, for free, until May 31st, 2026. If you’ve been looking for more powerful analytics — scheduled reports, preservation metrics, or the new fluctuation chart — the Pro plan is designed for you.
To explore the full set of new features, check out our feature guide in the Conserv Community.
We’re also hosting a live webinar on March 11th where we’ll walk through the new experience and answer your questions. Register here.
As always, if you have any questions, just reach out to us at support@conserv.io. We’d love to hear what you think.
We have a lot more coming to Conserv in 2026, and we’re excited to keep building the future of preservation analysis together!