Introduction
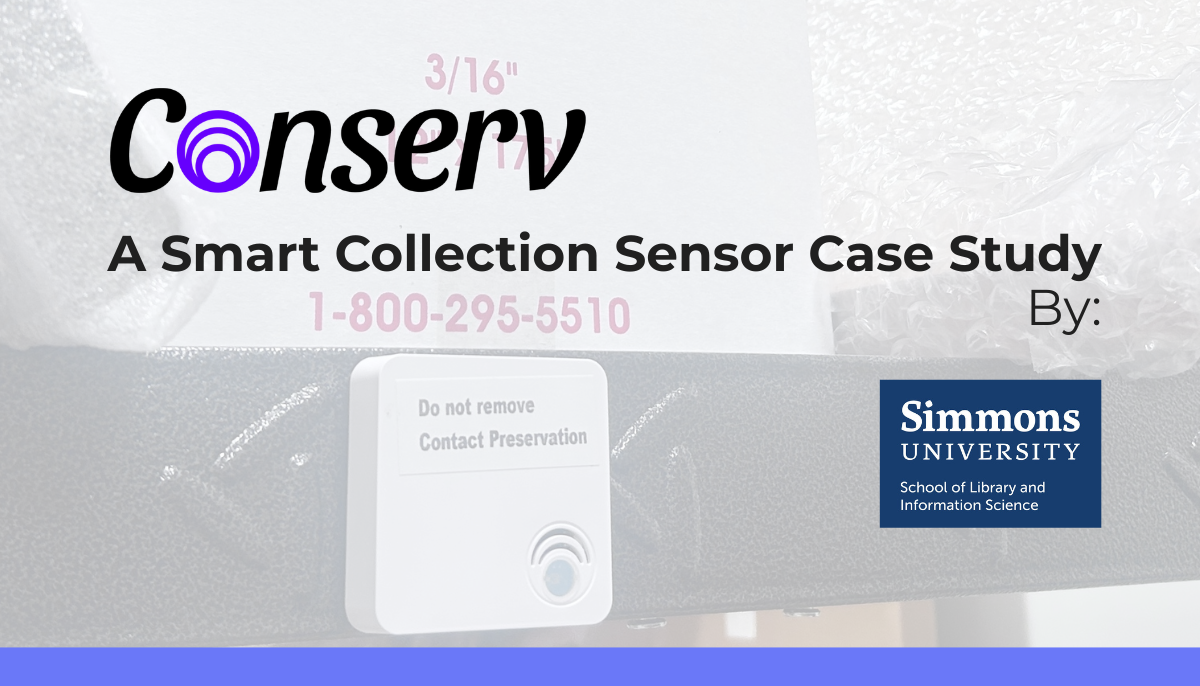
In Spring 2026, Simmons University’s School of Library and Information Science began offering a course for students to learn about and apply the principles of preventive conservation, including hands-on environmental monitoring for archives and museum collections. Under the supervision of Assistant Professor of Practice Donia Conn, students partnered with two local cultural heritage sites to perform surveys of their buildings and collections in the style of preservation needs assessments. One site was the archives of an academic institution; the other was a university art collection. For privacy reasons, both sites preferred to remain unnamed in this blog post.
To aid in their assessments, students used Conserv Smart Collection Sensors to gather data about relative humidity, temperature, and light, which then greatly informed the recommendations they made for their partner sites in their final preservation reports.
Getting Started
Students were split into two groups–one for each site. Each group had four Conserv Smart Collection Sensor units and a gateway with a pre-installed SIM card. One student from each site was placed in charge of calibrating and monitoring their site’s Conserv Sensors, giving them practical responsibility for environmental monitoring for archives and collection spaces. Emily Ha and Arden Boydstun, both in their final semester of Simmons’ Master’s of Library and Information Science program, took on this task.
Setup was straightforward. Due to having limited access to their partner sites, Boydstun and Ha completed the setup and calibration of their sensors at home. Prior to setup, Ha and Boydstun had each received an email invitation to access their Conserv Cloud Accounts, in which their respective gateway and sensors were already linked and viewable. After attaching the antennas to their gateways and plugging them into a power source, they confirmed that the gateways were connected via SIM card on the Conserv Cloud, then activated their sensors.
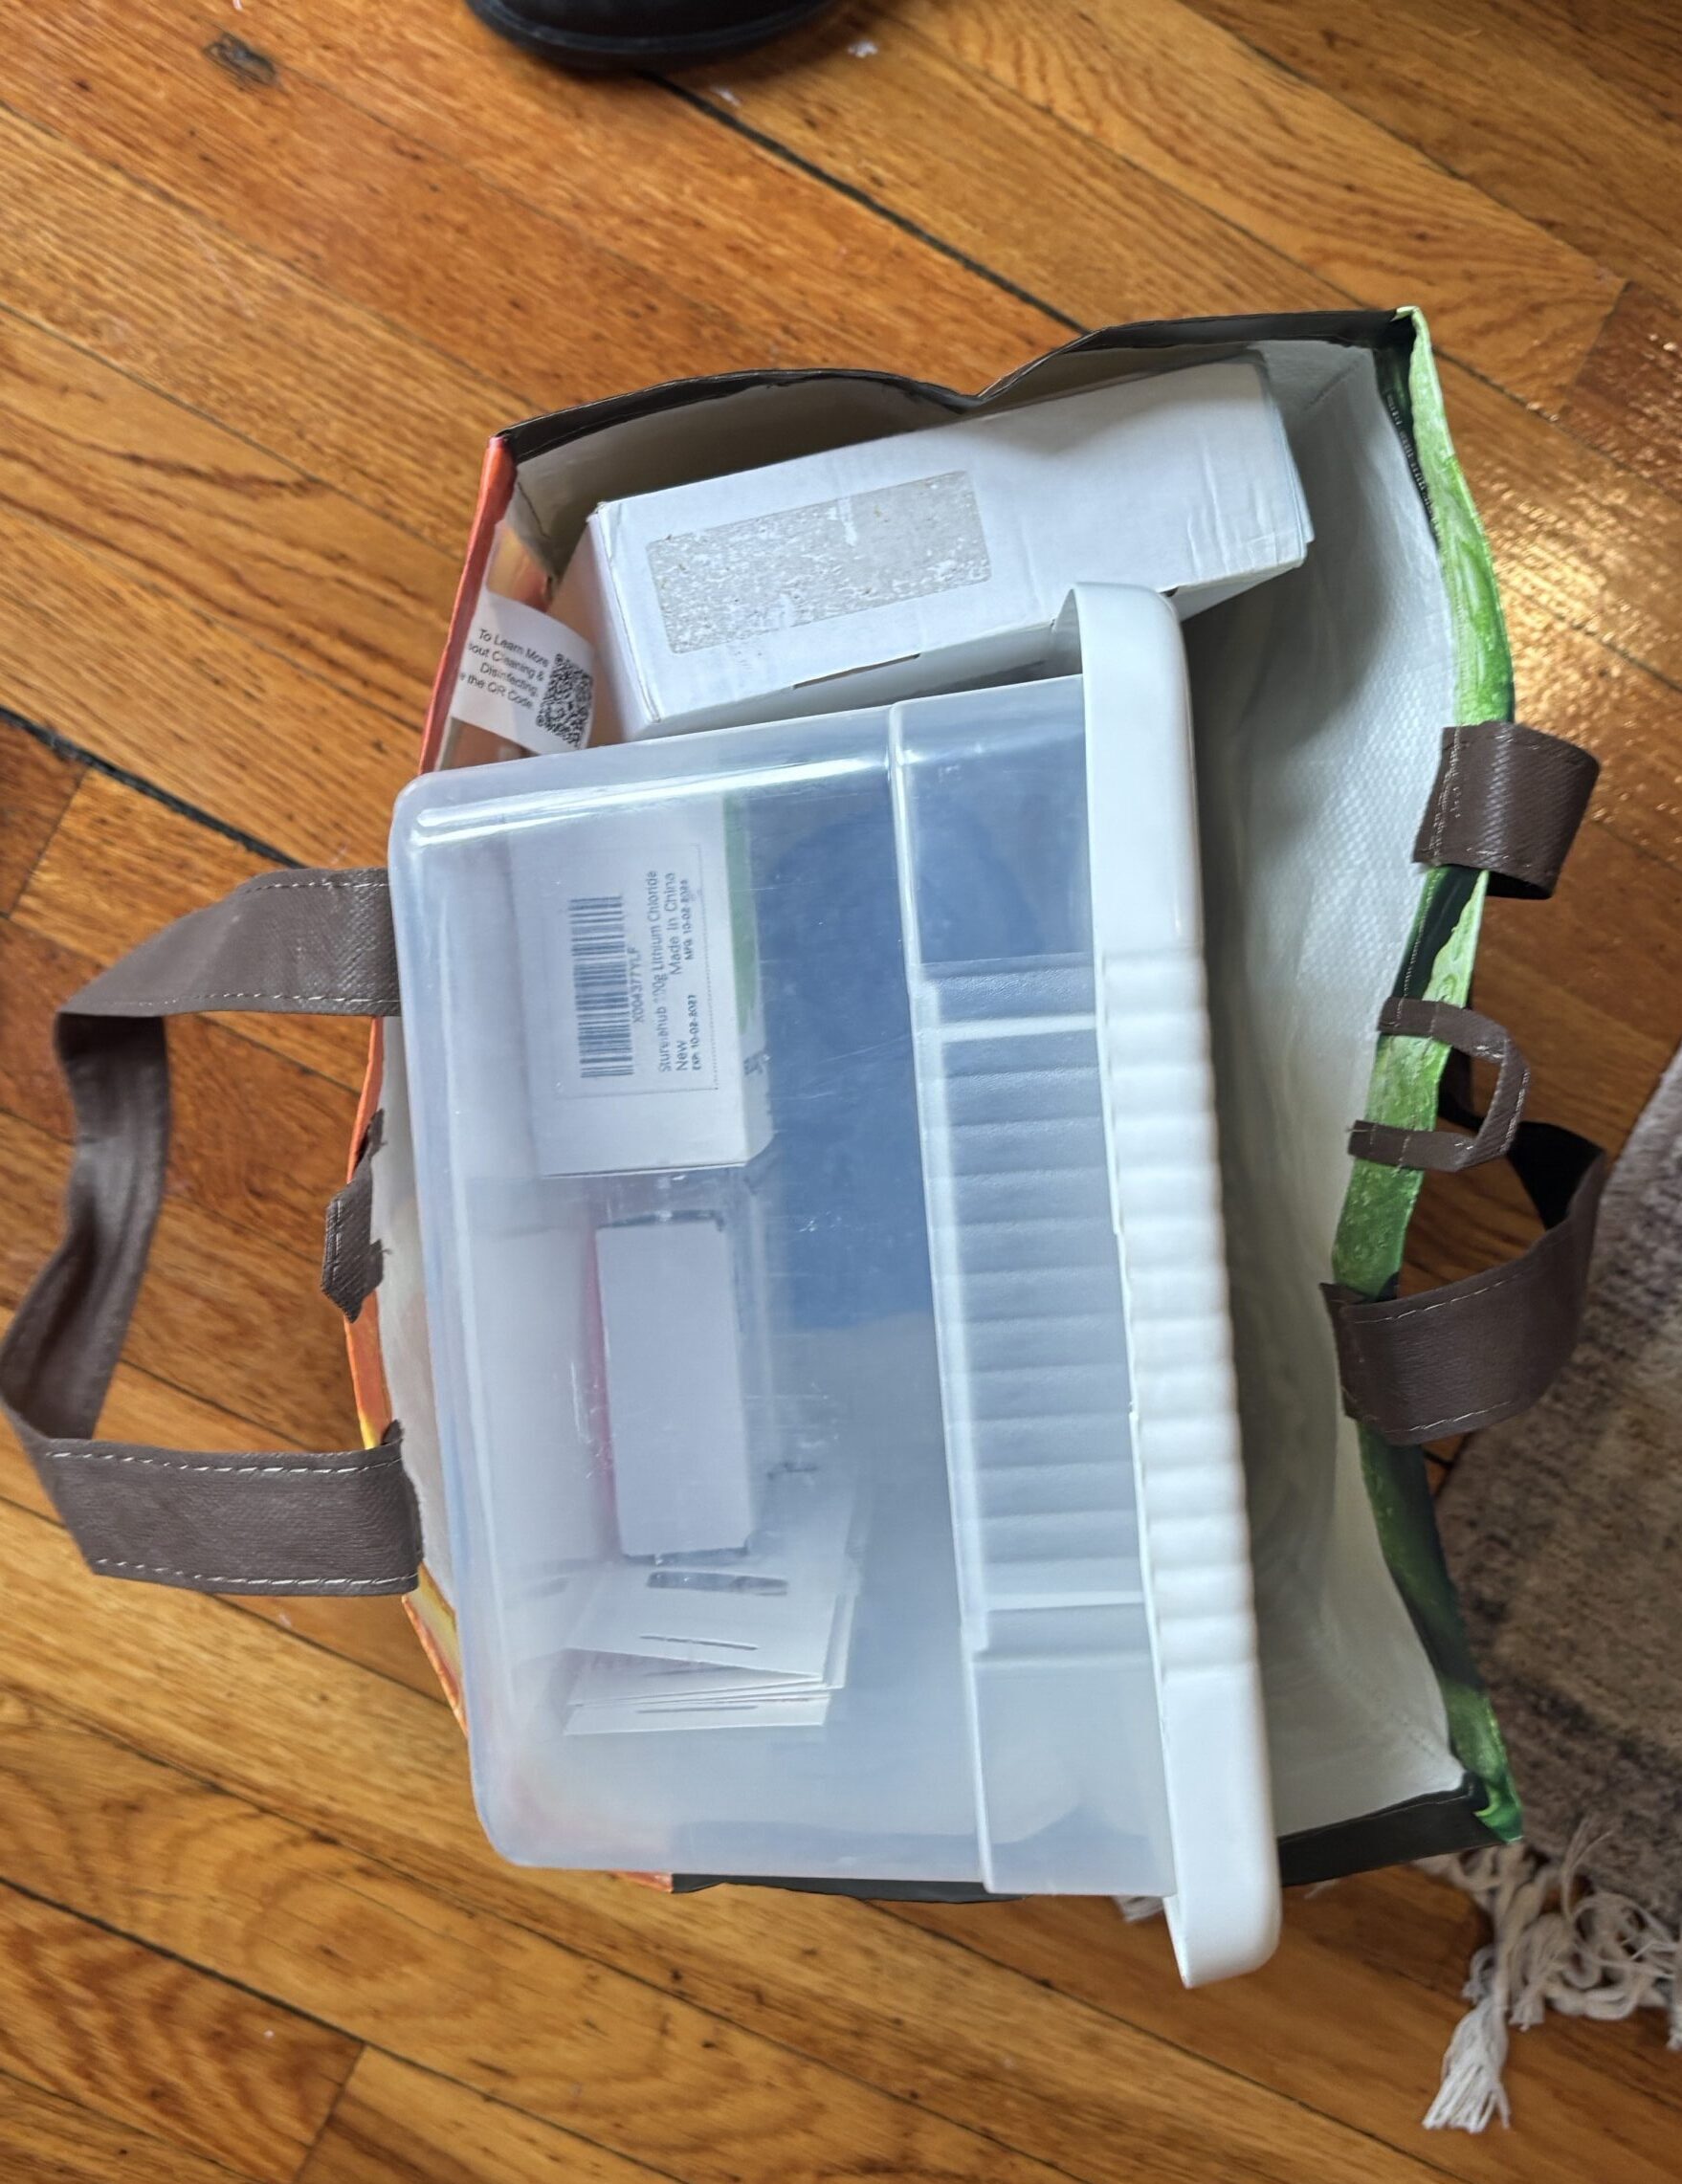
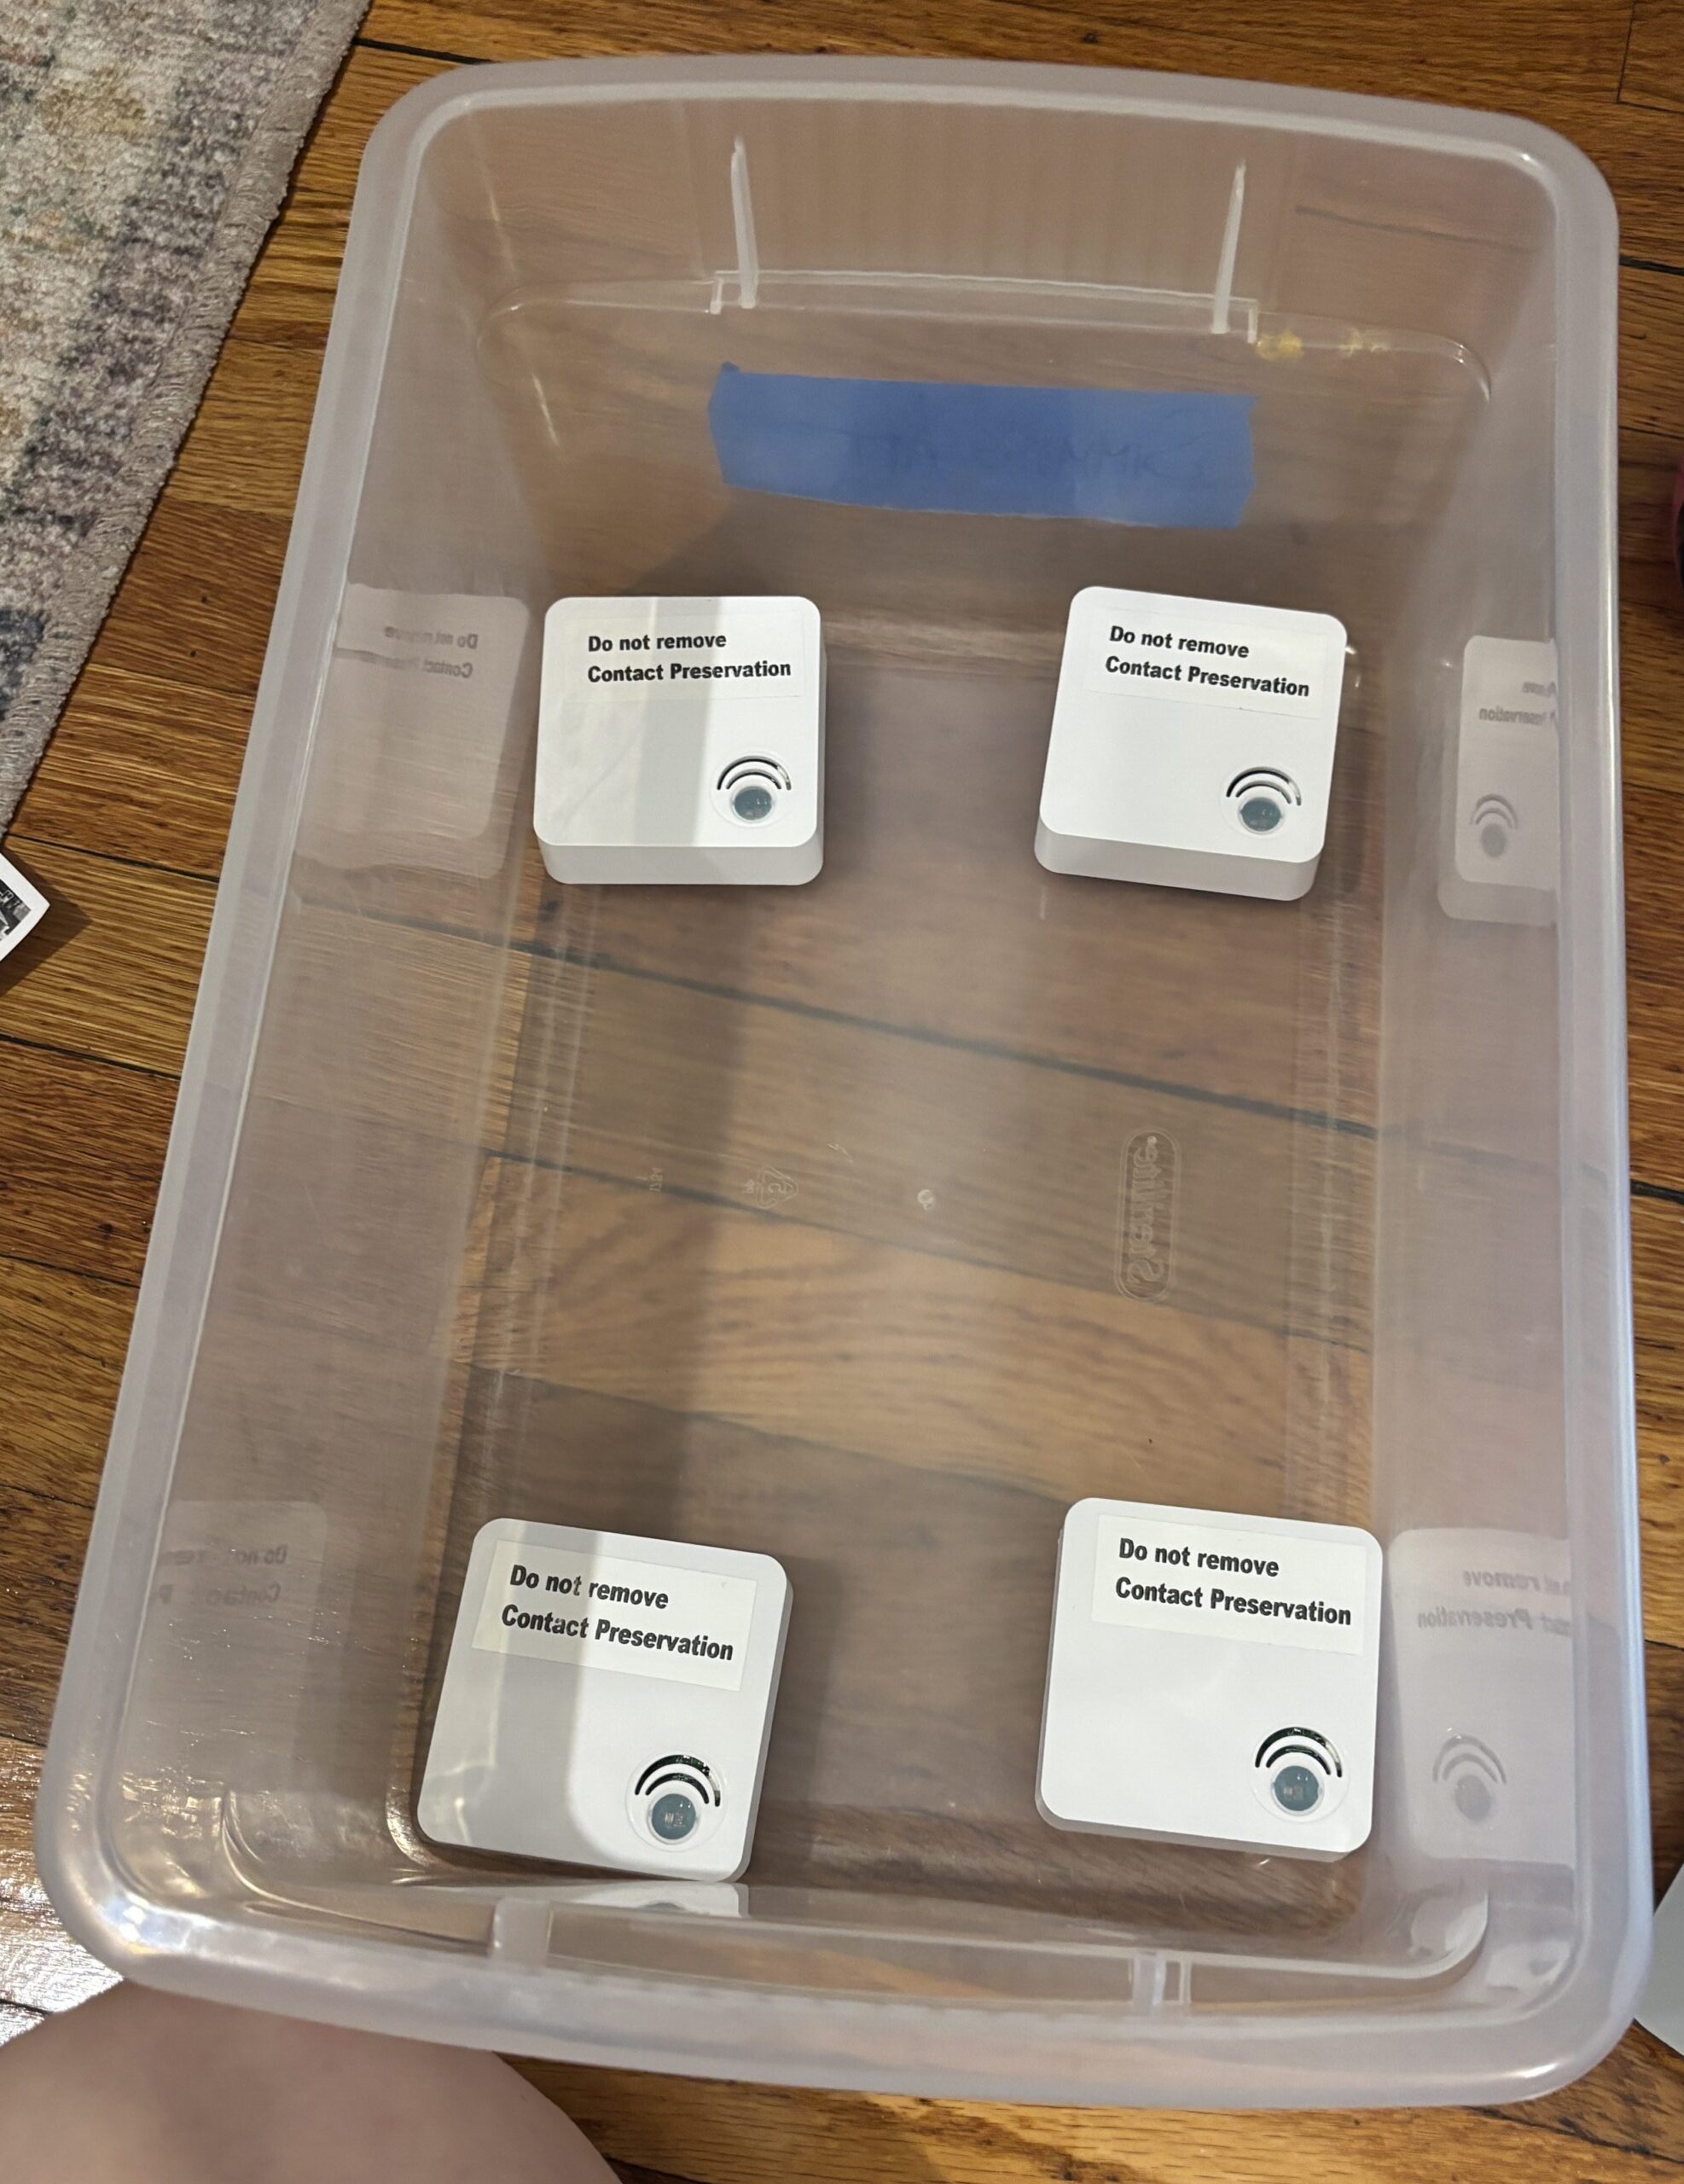
Though Conserv replaces sensors every three years as part of its Complete and Enterprise subscription models, removing the need to recalibrate them, for their class, Boydstun and Ha practiced calibrating their sensors using saturated salt solutions. This calibration method, as outlined by the American Institute of Conservation, involves placing environmental dataloggers in sealed chambers with saturated salt solutions known to hold specific relative humidity levels. Ideally, three different salts are used in order to test the full range of a sensor: lithium chloride (11% RH), magnesium chloride (33% RH), and sodium chloride (75% RH). As this was just a spot check for academic practice, Ha and Boydstun each used only one type of salt, observing the relative humidity data produced by their Conserv sensors over a 96-hour period to ensure their accuracy and stability. Following the Conserv documentation that outlined the experiment, Boydstun and Ha facilitated the test remotely from their homes, permitting the sensors to be brought pre-calibrated to the partner sites. The results fell within the Conserv Sensor accuracy range for their expected measurements, with some fluctuations that were likely due to the imperfections of a home calibration–mostly changing temperatures and the use of chambers without perfect seals. Though unnecessary, the calibration served as a quick assurance of the accuracy of Conserv’s sensors before they were installed in their observation environments.
Environmental Monitoring for Archives and Art Collections in Action
Students installed sensors at their partner sites on February 17, 2026, and gathered them at the end of their observation period on April 7, 2026, all the while tracking and comparing the data collected throughout the evaluation window using the Conserv dashboard. Sensors enabled students to test features of the Conserv platform in two contrasting storage environments, and in turn, played a key role in developing and informing discussion around collections care and advocacy over the course of the semester.
The Art Collection
The university art collection was moved into a space previously used as an administrative office in the summer of 2020. Due to the circumstances surrounding the time of the move, the space had not been assessed for its functionality as a long term storage solution. For this project, students were given the opportunity to assess the storage area in-person twice, and due to this limited access to the site, it was important the sensors be able to collect and provide consistent and accurate readings. The collections storage space, formerly an office, had little climate control, regulated by a split air unit and radiators. Collections storage practices stood out as a pain point in need of addressing as a part of the assessment, however. Considering prior collection shifting and instability in the university art collection, it was vital to assess if the present storage environment was suitable. By gathering information to understand the current environment, the assessment also served to establish a data baseline in which future recommendations could be rooted.

Once the Conserv gateway was installed in the collections storage space and transmitting signal readings on the Conserv Cloud, sensors were placed in order to monitor the impact of different systems within the space and identify potential environmental control issues. The group’s largest concern for the space was the presence of collections shelving along the room’s exterior wall, which featured two large windows and two radiator units. As the windows had been covered with UV-blocking film, UV light was not an immediate concern, although it was tested in this study.
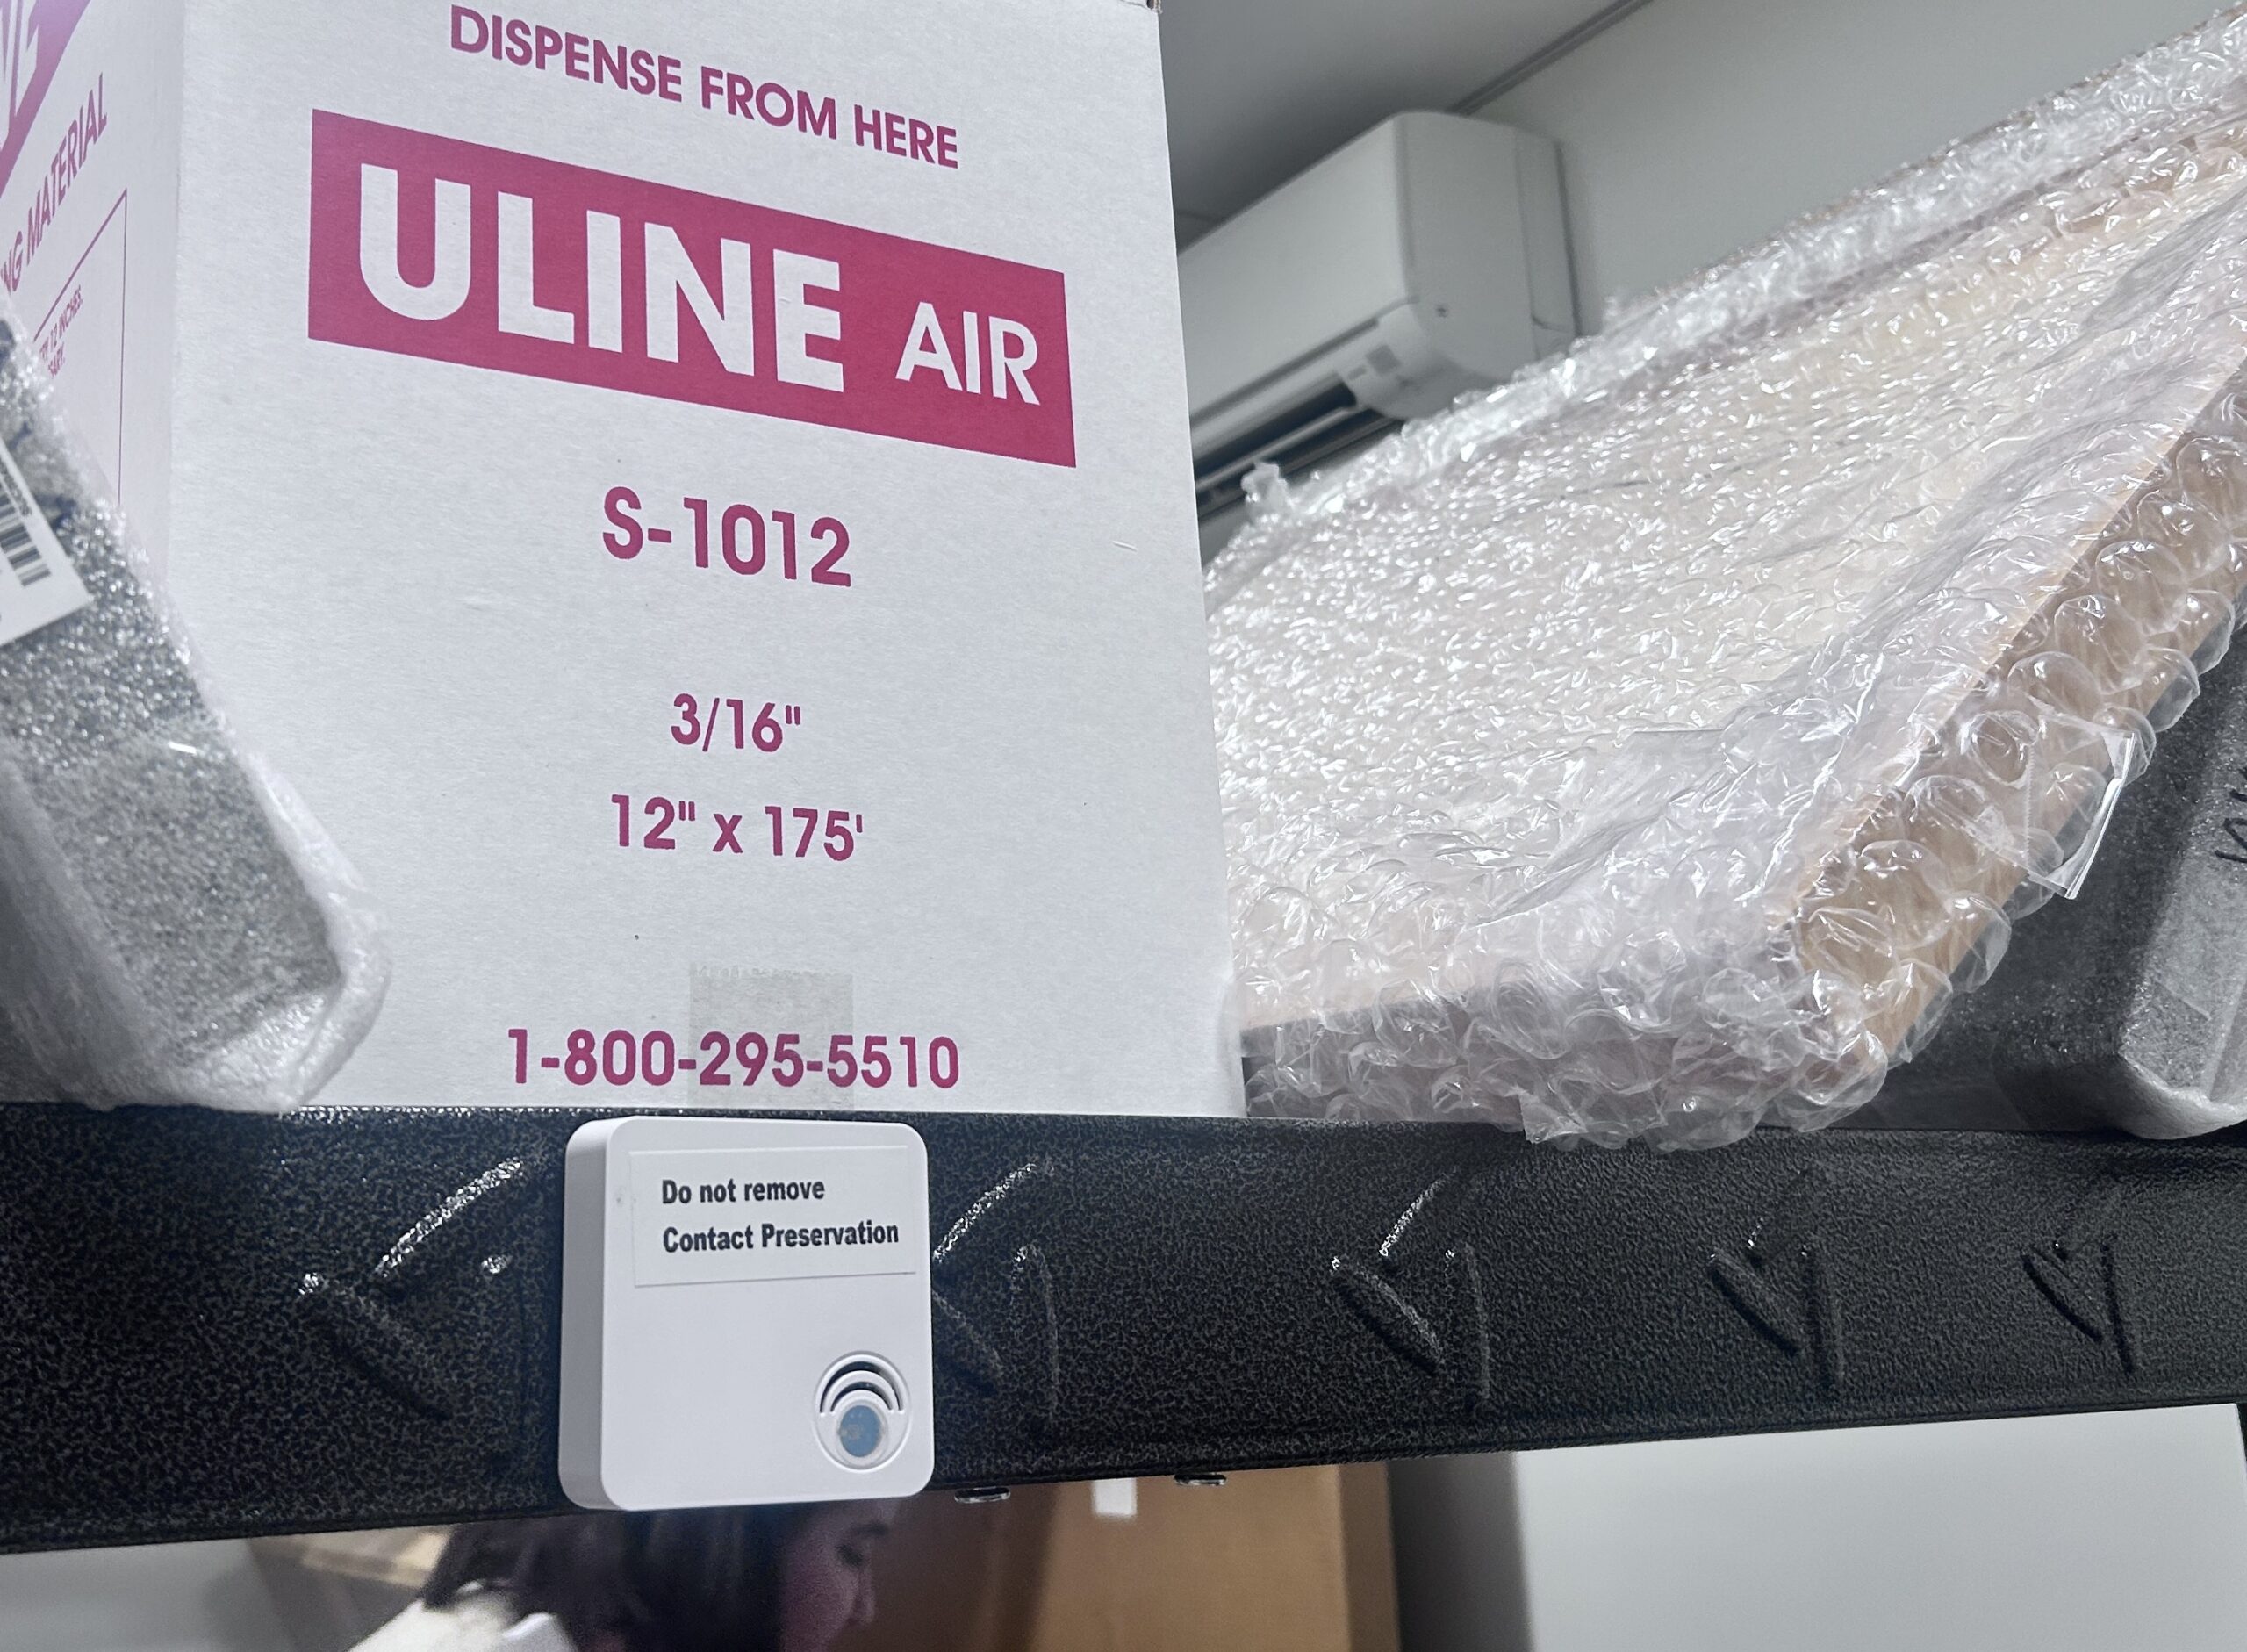
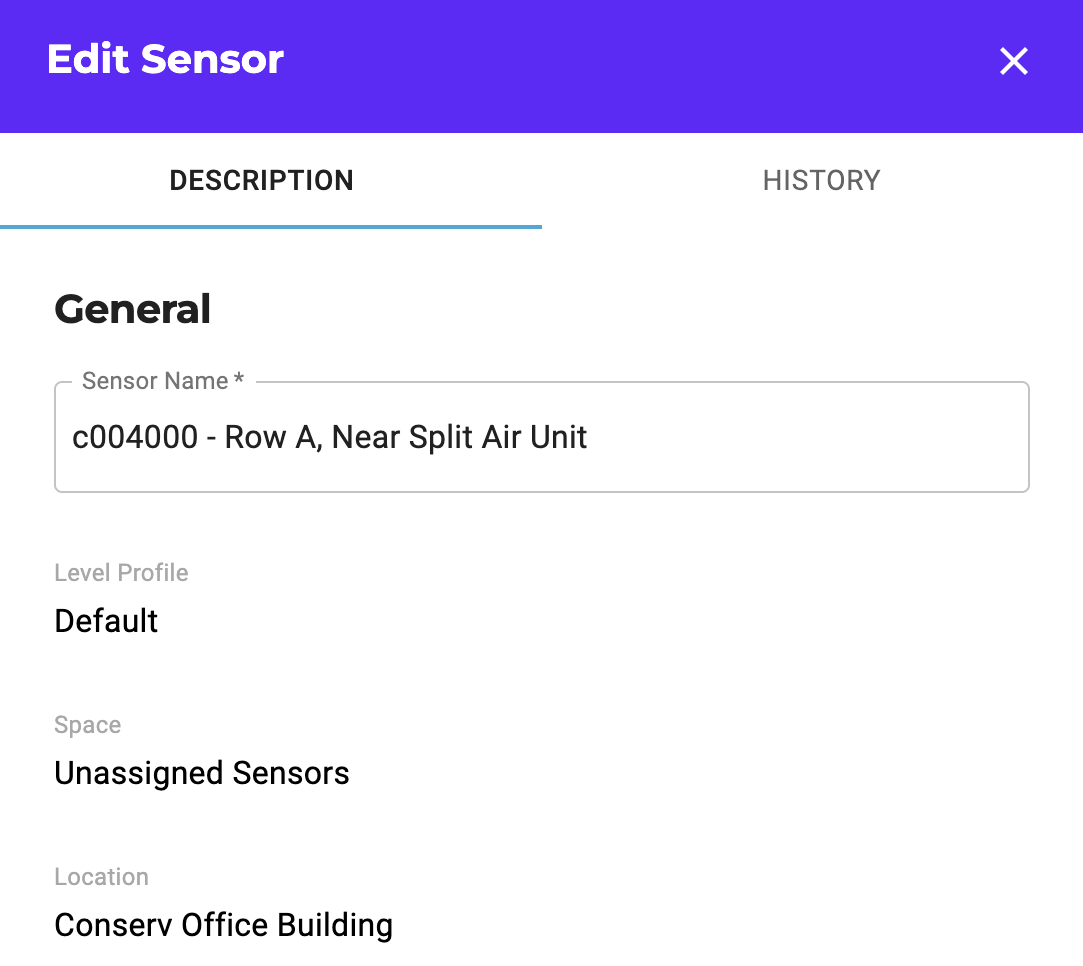
Students opted to focus their efforts on the potential influence of the heating and cooling mechanisms in the space. Three of the four monitors were placed on shelving units closest to each area of concern: one next to the split air unit, one along the exterior wall, and one near the entryway. The last monitor was placed in the center of the room as the control sensor. As the units were placed, group members utilized tools in the Conserv dashboard in order to make the data more identifiable when being accessed remotely, including renaming the sensors to include their physical position in the room, as well as attaching photos of each sensor’s location.

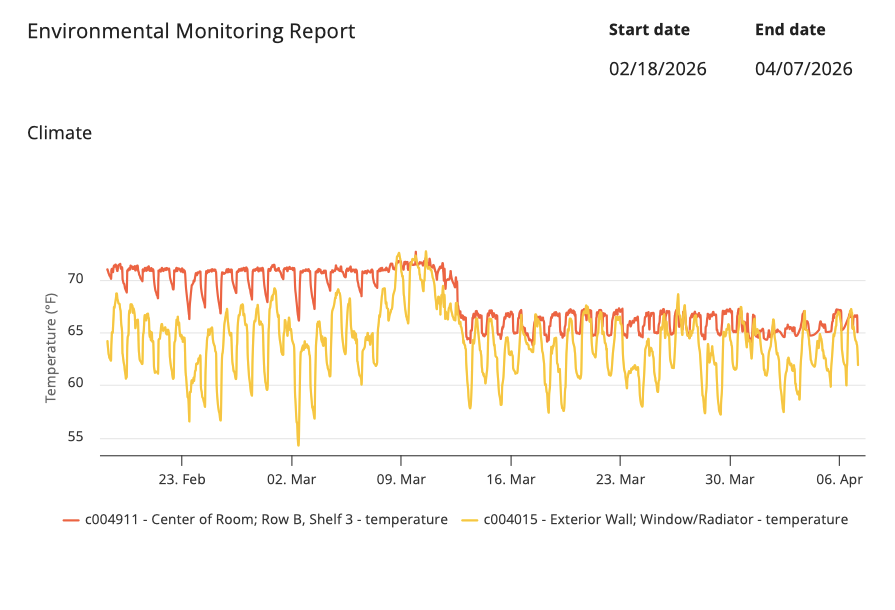
Knowing the stability of the environment allows the current and subsequent collection stewards to advocate for an equivalent space if needed in the future and helps to safeguard against arguments for inadvisable moves. In the case of the art collection, the most useful application of the Conserv data was in the ability to parse out spikes in data and compare them to the weather logged for the same window of time. Specifically, the sensor placed along the exterior wall demonstrated the area being sensitive to temperature and humidity fluctuations. This data informed the group’s recommendation to move material away from the exterior wall when making adjustments to the present collections storage configuration to account for this charted instability. Given the art collection stewards cannot create new storage spaces, the data collection provided insight in developing recommendations for a more thoughtful layout of material to account for the environmental pitfalls.
Inside the University Archives
The university archives were located in a cordoned-off section of the top floor of a multiuse academic building. The most notable feature of this space was a large, copper-trimmed skylight that spanned most of the length of the ceiling. The skylight was a known issue for the archives; aside from allowing near-constant, unfiltered sunlight into the collections storage area, it had a history of leaking, and evidence of water infiltration could be seen throughout the floor. Aside from the skylight, the archives also suffered from a lack of consistent HVAC control, as the area was equipped with only a few heaters and had no cooling or humidity regulation systems. The university archivist hoped that the assessment performed by Simmons’ Preventive Conservation class would provide evidence that could be used to advocate for increased resources for the archives and a change of location.
The Conserv gateway’s built-in SIM card proved especially useful for environmental monitoring for archives at this site, as there was no ethernet port available within the space. Once plugged in, the gateway immediately began transmitting signal readings on the Conserv Cloud. Within minutes, the sensors were online and providing environmental data.
Based on recommendations for placing sensors listed on the Conserv website, and in order to prioritize accurate temperature and relative humidity readings, students placed sensors out of direct sunlight, in unobtrusive locations on shelves throughout the collections storage area. One sensor was placed in an additional closet that the archives used for occasional overflow storage. The closet was experiencing an active leak at the time the sensor was placed, meaning that environmental data collected by that sensor provided a real picture of how water infiltration affected the ambient conditions of the space.
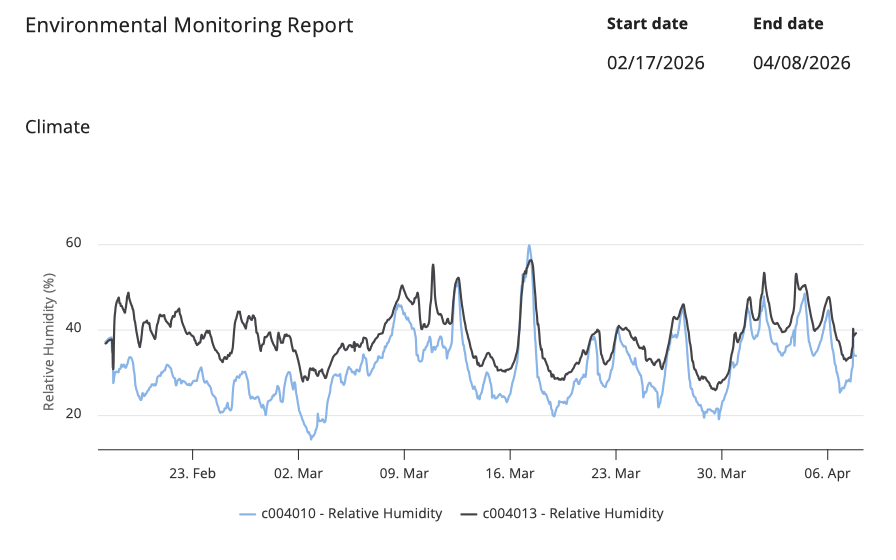
As expected, the relative humidity of the storage closet was consistently around 10% higher than that of the general collections storage area while the leak was active. To students’ surprise, though, the relative humidity of the closet continued to be about 5% higher than the general collections storage area even after the leak was resolved in early March. Historical environmental monitoring data gathered by the archivist in the general collections storage area indicated that relative humidity regularly peaked at 70% in the summer months–already higher than what is commonly recommended for safe storage. Students could thus infer that the relative humidity in the closet was likely even higher than 70% in the summertime, rendering the space especially inadvisable for continued use due to its heightened risk of mold growth, even if the closet leaks were permanently resolved. On the opposite end of the spectrum, data reported by the Conserv sensors in the general collections storage area during the observation period showed that the area regularly suffered from overly low relative humidity during the winter, with wide fluctuations that could create instability for collections materials. The Conserv dataloggers proved that neither space was ideal for collections storage, and provided ample data for the archivist to use when advocating for a new space.
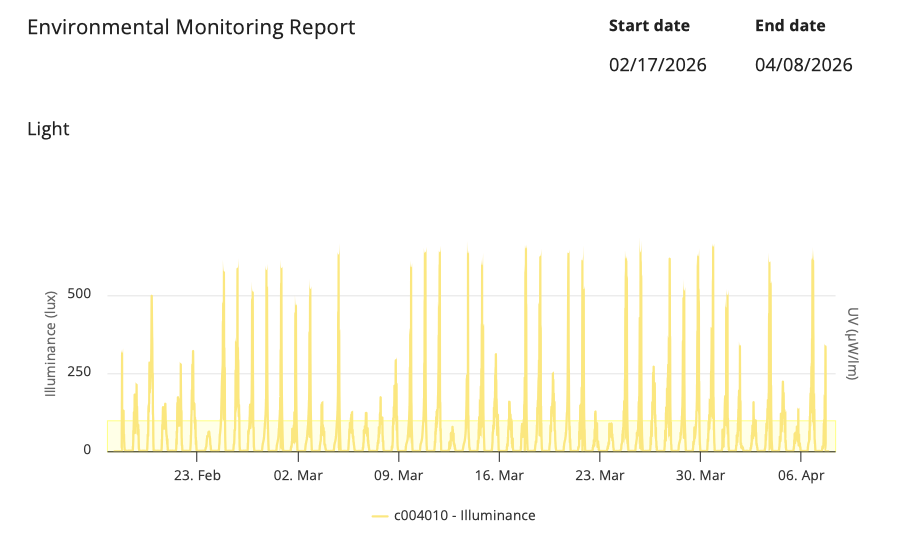
Aside from relative humidity data, students were able to draw on illuminance measurements in their final reports. The lux readings produced during the observation period showed that even in indirect sunlight, the intensity of light introduced by the skylight into the general collections storage area–not to mention the duration–was excessive and, therefore, deleterious to collections. One sensor regularly recorded readings near or above 600 lux on sunny days. While the archivist was fully aware that light was a persistent and pervasive issue within the university archives, having concrete measurements to point to will strengthen their appeals for increased resources, like funding for more records cartons and other light-blocking materials.
Experience Takeaways
Across both sites, environmental monitoring for archives and art collections proved to be an effective method for meeting the varied needs of the students analyzing the data collected as well as for the environments monitored. For example, exterior weather and precipitation data served as a strong argument for updates to storage practices in the Art Collection to move collections material away from exterior wall, by providing an analytics dashboard that allowed for side by side comparisons of the sensor readings. Remote access to the Conserv environmental monitoring systems enabled students to carry out this project while simultaneously maintaining the security measures in place by the partner institutions and provided a less invasive approach for observing preservation quality of the environmental conditions over time. Conclusively, working with the Conserv dashboard and system provided invaluable practical experiences with real-time environmental monitoring systems, robust data analysis tools, and building consensus oriented dialogue between peers.
About the Authors