Did you know that Conserv’s environmental monitoring software can be incredibly helpful for preventive conservation, even if you don’t use Conserv sensors?
For the last two years, Conserv has become an essential tool in my work as a Preventive Conservator at the Museo Chileno de Arte Precolombino, even though I don’t have their bespoke automatic sensors. Instead, I use the ones the museum has always had: eight Tinytag TGU-4500 data loggers and four Testo 174H sensors, whose data is not collected in real time but downloaded manually via USB. The environmental monitoring software even works with inexpensive household Bluetooth thermohygrometers!
Life Before Conserv
Before using Conserv, my routine involved taking measurements in different spaces throughout the museum at different times of the year using all the available sensors. Then, I had to download all the data and organize it into Excel files, where I created specific graphs depending on what I wanted to analyze. This process required a considerable amount of time.
For example, if I wanted to compare environmental conditions in different museum spaces during the same period, or analyze how the same space behaved during the same season across different years, every new comparison meant creating another Excel file, copying and pasting the relevant data, and generating a new graph to answer each new question that came up.
With Conserv, that long and monotonous workflow is over. The environmental monitoring software gives me a single, centralized place where all the environmental data ever collected in the museum — even data recorded by conservators before I joined the institution — is stored, visualized, and analyzed with just a couple of clicks.
Getting the Bigger Picture
The environmental monitoring software has been incredibly helpful in understanding how each space inside the museum behaves on a monthly basis and in comparing whether those patterns are consistent across all rooms or vary depending on their location and infrastructure (Image 1 and 2). It has also made it much easier to prepare reports on the environmental conditions during a specific month over the past two years. Reports that once took a long time to produce can now be prepared quickly while still being concise and comprehensive for colleagues across the institution.
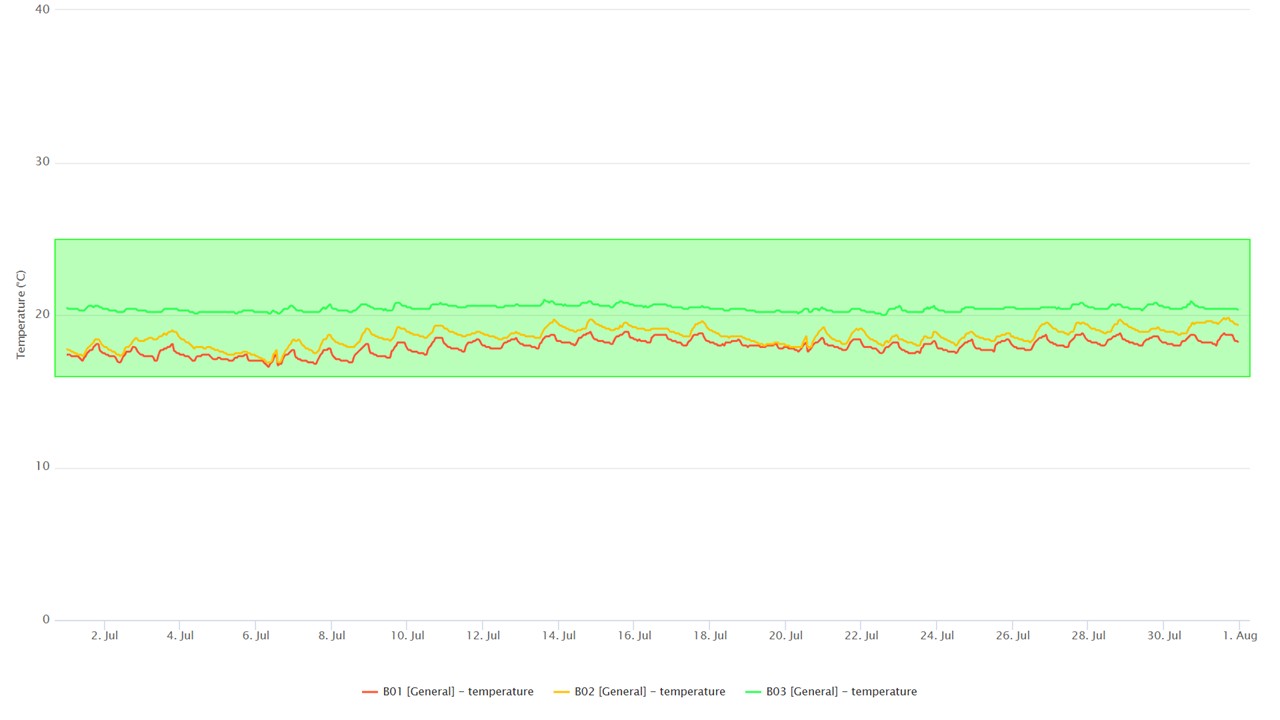
Comparison of temperature measurements recorded during July 2026 in three different storage spaces. The light green rectangle highlights the range between 16°C and 25°C.
Image 1
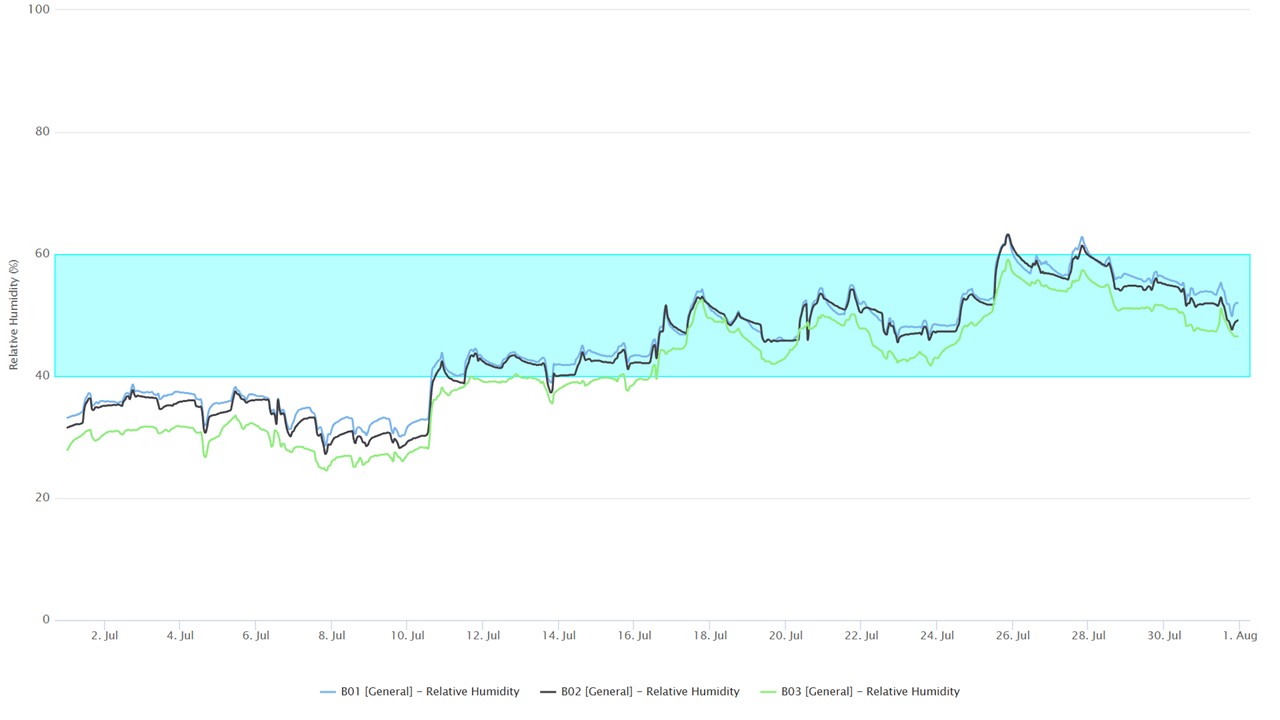
Comparison of relative humidity measurements recorded during July 2026 in three different storage spaces. The light blue rectangle highlights the range between 40% and 60%.
Image 2
The environmental monitoring software has also helped me answer some crucial questions I had when I first started analyzing the museum’s environment.
For context, our HVAC system only controls temperature; relative humidity is managed indirectly through temperature control. Because of this, I always wondered whether the fluctuations I observed in relative humidity depended mainly on the HVAC temperature set point, or whether they were actually influenced by the number of visitors on a given day, as some of my colleagues suggested.
Want to try the free software for yourself?


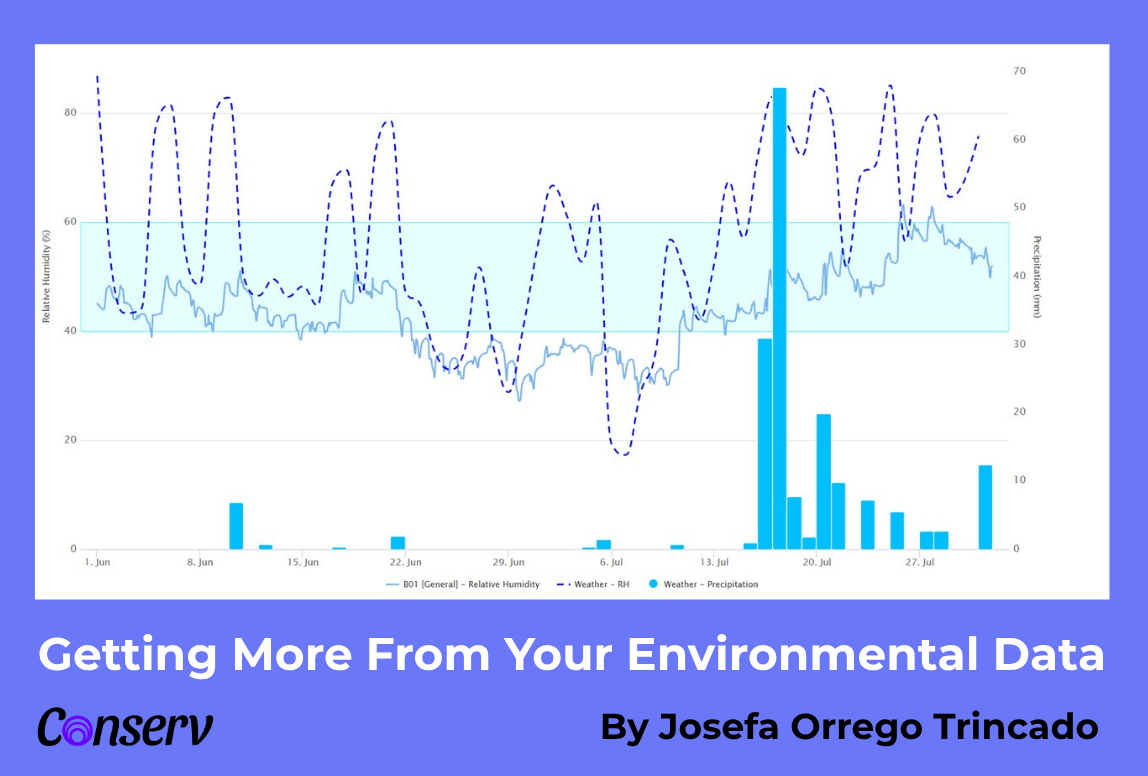
Thanks to Conserv, which recently incorporated the ability to visualize outdoor weather data, I have now been able to clearly identify a pattern: the relative humidity inside our exhibition rooms and storage spaces is influenced primarily by the outdoor relative humidity conditions (Image 3). The software has also helped me appreciate the building’s buffering effect on this parameter, identify which rooms buffer outdoor conditions more effectively, and determine which spaces are therefore more suitable for housing certain types of collections. Finally, one long-standing question had been answered: for us, most of the time, visitors are not responsible for the fluctuations in relative humidity.
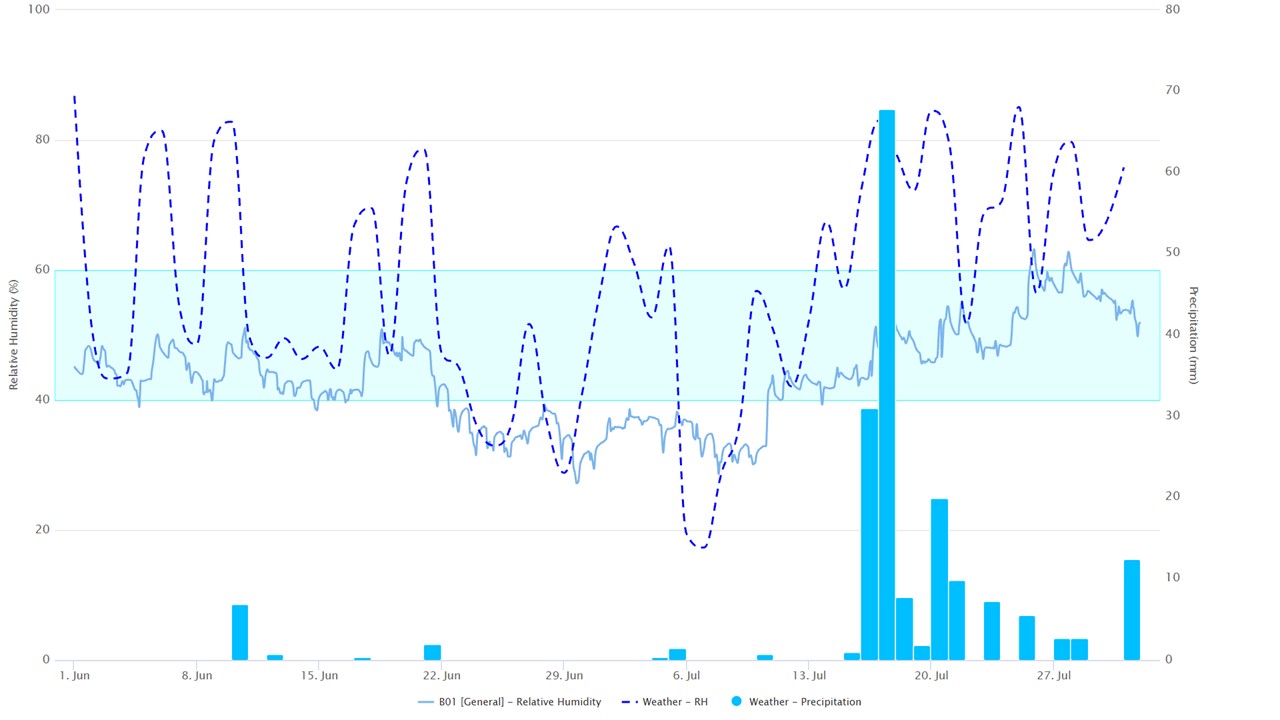
Relative humidity measurements recorded during June and July 2026. The solid light blue line shows measurements taken inside a particular storage space, while the dotted blue line shows the relative humidity outdoors in Santiago, Chile. The blue bars show precipitation recorded in the city during the same period.
Image 3
Digging Deeper
As those broader questions were answered, new ones naturally emerged. Once again, Conserv helped me explore them.
Organizing Data in Environmental Monitoring Software
When I started using the software, I organized all the data by assigning Exhibition Rooms and Storage Spaces as “Locations”, then subdividing each of them into “Spaces”, corresponding to individual exhibition rooms or storage areas, and finally assigning the respective sensors to each one (Image 4). This structure worked very well for understanding the overall environmental behavior inside the building. However, because we still observed fluctuations in some parameters despite having an HVAC system, it naturally led to another question: what are the actual environmental conditions surrounding the objects themselves?
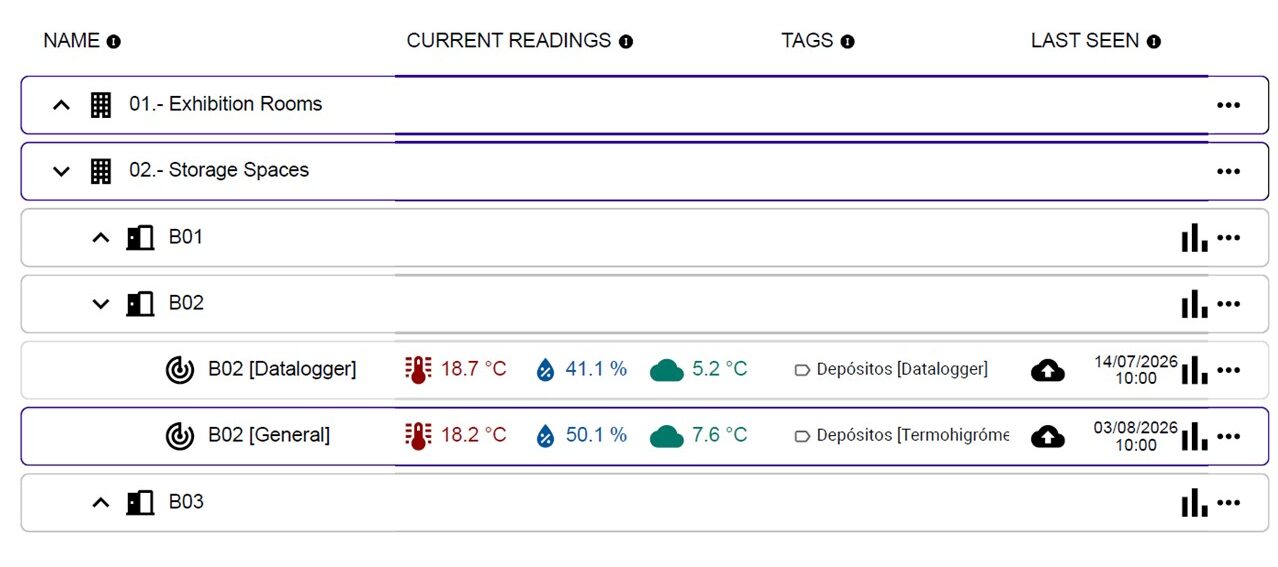
Organization of locations, spaces, and sensors in the Conserv software.
Image 4
For example, are some exhibition cases better at buffering external conditions than others? Do certain storage enclosures provide a more stable environment for collections with specific environmental requirements?
Ultimately, I wanted to better understand the microenvironment the objects actually experience, so I could make better-informed preventive conservation decisions.
Turning Questions into Research Projects
With those questions in mind, I created a new Location called “Research Projects” and subdivided it into Spaces named after the questions I wanted to answer, such as “Textile Storage Solutions” and “Metal Storage Solutions”, to evaluate which storage mounts provide the most stable relative humidity for these materials, or “Exhibition Cases” to assess how well exhibition cases buffer fluctuations in relative humidity (Image 5).
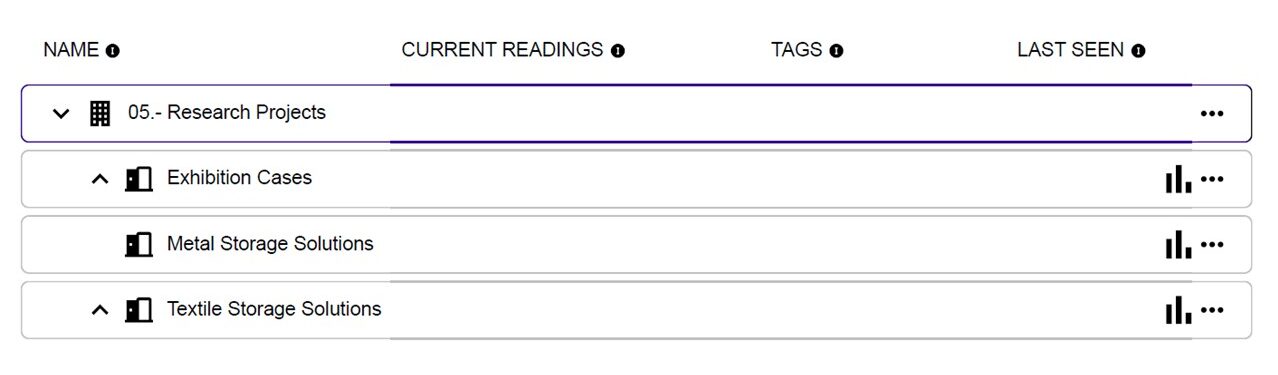
Creation of a new location named “Research Project,” subdivided into different spaces according to the specific issue each space was intended to address.
Image 5
The visualizations and analyses provided by Conserv allowed us to reach some valuable conclusions. In the case of textile storage, where we were trying to maintain a higher and more stable relative humidity than our building average in order to reduce the risk of mechanical damage to the fibers, polyethylene enclosures used as a final protective layer created a much more stable microenvironment than other storage solutions, such as Tyvek envelopes alone (Image 6).
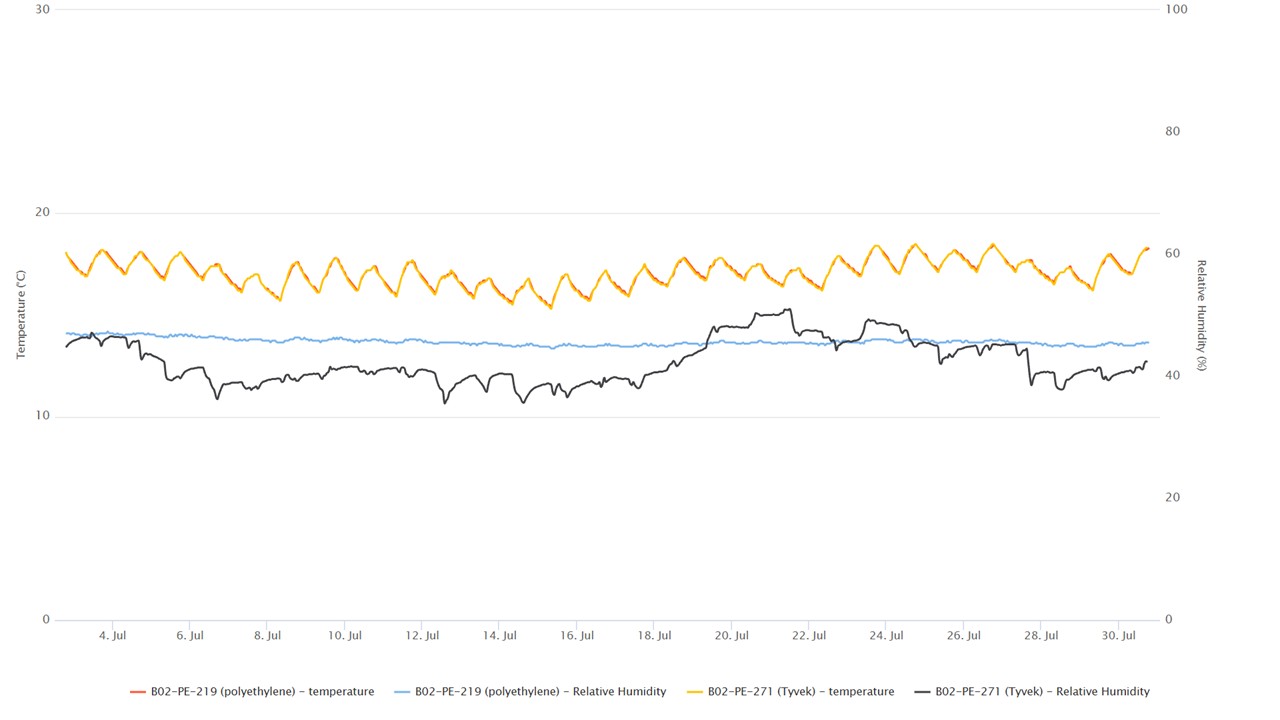
Comparison of temperature and relative humidity measurements recorded during July 2026 between a storage mount made entirely of Tyvek and one incorporating an outer layer of polyethylene.
Image 6
We also evaluated how well our exhibition cases maintained stable relative humidity conditions (Image 7).
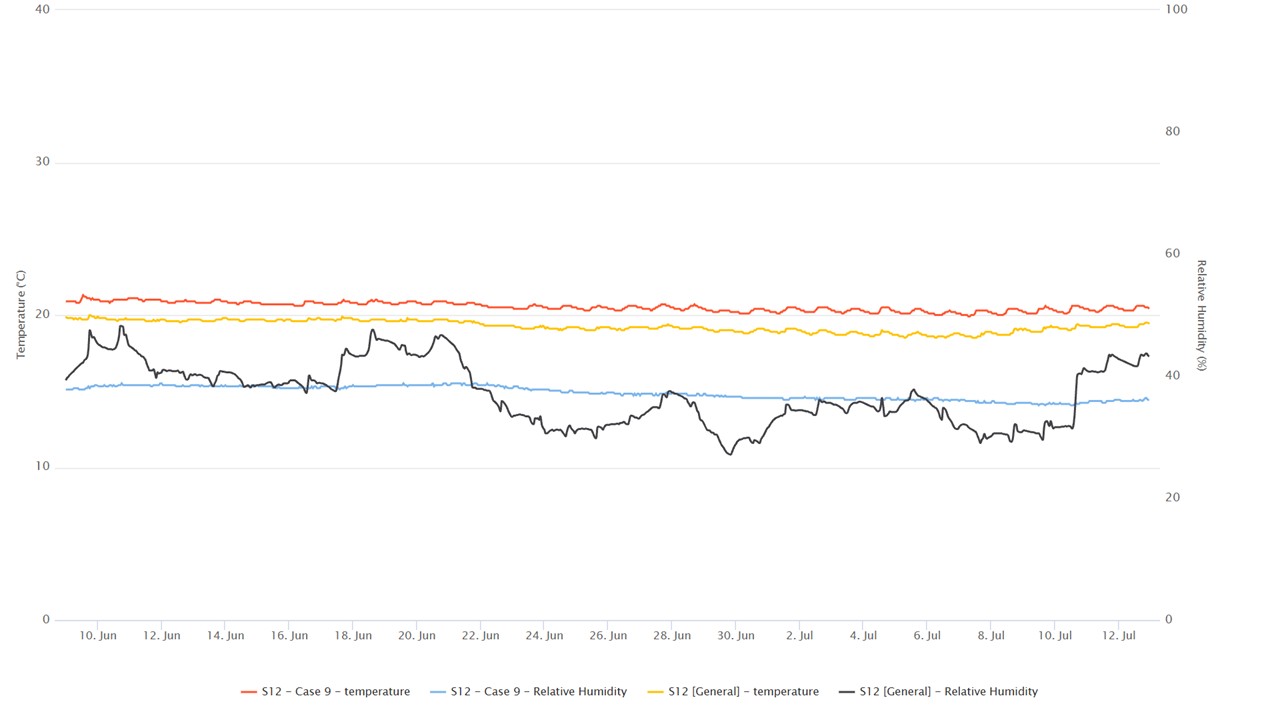
Comparison of temperature and relative humidity measurements recorded during June and July 2026 between the interior of an exhibition room and the interior of a particular exhibition case located within the same room.
Image 7
Together, these two small research projects have started to answer a much broader question: do we really need to invest in a new HVAC system capable of mechanically controlling relative humidity, or can passive solutions achieve similar results? So far, local, passive, and more environmentally sustainable solutions seem to be taking the lead — and Conserv has been an invaluable tool for helping us reach those conclusions.
Beyond Data Collection
Conserv has changed the way I work, not because it collects better data, but because it helps me make better use of the data I already have. Instead of spending time organizing spreadsheets and creating new graphs every time a question comes up, I can focus on understanding how our museum environment behaves and making better-informed preventive conservation decisions.
Whether the question is about an entire exhibition room or the microenvironment inside a storage enclosure, having all that information in one place makes it much easier to find meaningful answers and communicate them clearly to colleagues. Best of all, you don’t need to invest in new sensors to get started. If you’re already collecting environmental data with your existing dataloggers, chances are you already have everything you need to begin gaining deeper insights into your collections and your building!
About the Author