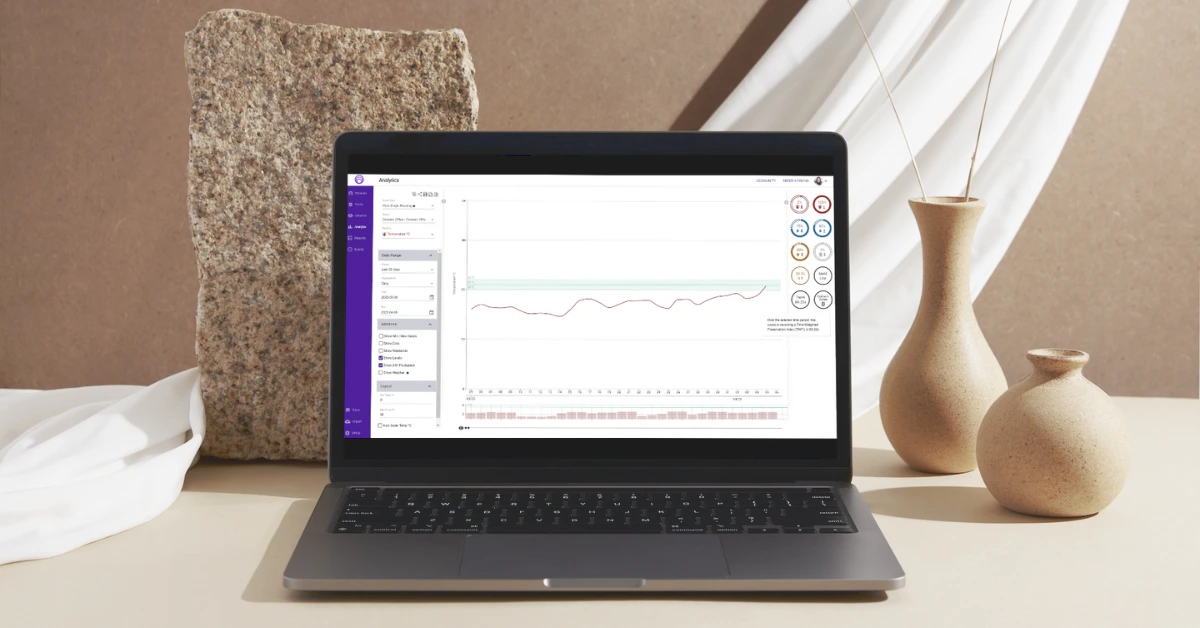
Environmental monitoring software is an indispensable tool that helps collections care professionals to track and manage the environmental conditions of their collections. When monitoring a collections environment, you will need to keep an eye on temperature, relative humidity, dew point, and even light. You could certainly import your data logger tables out to Excel and start building your own graphs there, but this could take you a long time – and unless you (or your colleague) take the time to build some bespoke nifty macros to create automatic reports, you would still have to make those separately in the end. By using environmental monitoring software, you will be able not just to collect and store data from your loggers, but it will also allow you to automatically visualize and analyze data from various sensors and devices and use this information to make informed decisions about the best conservation strategies for your collections.
What is environmental monitoring software?
Without getting technical, we can say that environmental monitoring software is a program or application that will help you visualize and monitor the environmental conditions your data loggers are reading. Depending on your brand of software, it will either be installed on your computer or work from a browser or even a mobile app. Generally speaking, the software you use will be tied to the sensors you bought, although many software packages today will allow you to manually upload data from data loggers from other brands. If you would like more information about specific brands of environmental monitoring software, check out our article on Data Logger Software Options For Collections Care where we go over the most common brands of software you can find in the heritage field.
What will environmental monitoring software do?
The capabilities of your software will be entirely dependent on the brand you choose. Be aware that different brands of data loggers currently used in the heritage industry may have been originally designed and are, in fact, intended for other fields (many of them for pharmaceutical uses) – so their software applications will be aimed at these particular use cases. Still, they have been very useful for our general purposes, so what will software do?
- Collect and compile data from various sensors and devices, such as thermohygrometers, data loggers, light meters, UV meters, pollutant monitors, etc.
- For wireless options, it will store data in a secure database or cloud service.
- Visualize data in graphs, charts, maps, dashboards, etc.
- Analyze data using statistical methods, such as mean, median, standard deviation, minimum, maximum, etc.
- In some cases, like eClimateNotebook or Conserv Cloud, it will also allow you to set certain parameters for real-time alerts in case of undesirable conditions.
- Also, in eClimateNotebook and Conserv Cloud, the software may crunch certain preservation-related metrics to give you a better idea of mold risks or general conditions.
- Generate reports and alerts based on predefined thresholds or criteria. In the case of Conserv Cloud, it will generate automatic facilities reports you can use for grant applications or other pitches related to decision-making.
- In the case of Conserv Cloud, you will be able to have your Integrated Pest Management monitoring system on the same software.
- Share data and reports with stakeholders, such as curators, conservators, managers, consultants, loan officers, etc. Many software applications will allow you a number of users who can gain access to your graphed data without the need to download PDFs and share over email.
Notice how many of the above points simply could not be solved by Excel, or if they could, it would not be without considerable time input from a person who definitely has better things to do with their limited time.
What can the software help you do?
The point of both environmental monitoring and its software is to help you monitor and slowly improve the conditions surrounding your collections. Solid software will allow you to:
- Zoom in and out of different time periods to help you understand the current and historical environmental conditions of your spaces.
- Identify potential risks and sources of deterioration based on spikes and graph anomalies.
- Evaluate the effectiveness and efficiency of environmental control systems, and possibly detect issues with the systems before they result in affected collections.
- Implement preventive conservation measures to mitigate or prevent damage by identifying problematic areas and ways to improve the building envelope.
- Optimize the use of resources and energy for environmental management.
- If you are using light quotas and monitoring lux exposure, you may enhance the accessibility and usability of collections for research and education purposes by increasing or decreasing circulation/exhibition.
How to interpret data from environmental monitoring software?
Interpreting data from environmental monitoring software means understanding what the data means and how it relates to the preservation and deterioration of cultural heritage materials. To interpret data from environmental monitoring software, start with a solid understanding of the following:
- The characteristics and properties of the materials in your collections. Are they organic or inorganic, and within those general categories, what are they made of and how old are they?
- The environmental factors that can affect the materials in their collections. Are your collections more likely to be affected by mold, heat or light or all of them together?
- The acceptable ranges and limits for each environmental factor for each material type. Keep your special collections separate from the more resistant materials. What are the changing standards for environmental conditions these days? Don’t forget to take into account sustainability, energy use, and local weather.
- The sources of variation and uncertainty in the data. Are there particular spaces that behave differently? Do you know why? Investigate if not! Knowing your building and how its design and materials affect your indoor environment is key.
- Compare and contrast data from different sensors, devices, locations, periods, etc. How are my storage spaces behaving compared to exhibition spaces? Is the east facing wall exhibition room full of windows behaving similarly to a windowless archive room? Is the relative humidity inside a display case with silica gel still working fine compared to the ambient of the gallery after one year? Remember to add an external sensor to your building so you can understand if something happening inside your building is caused by the outdoor conditions.
If you need more detailed information on how to interpret the data you have, don’t miss our article on Environmental Data Analysis In Collections Care.
Limitations of environmental monitoring software
While a good environmental monitoring software will make your life much easier, it will have some limitations that you should be aware of.
- When working correctly, the software will be reflecting the data collected by your devices. This means you need to be sure your devices are working properly. Keep an eye on the installation, calibration and maintenance of your data loggers to make sure they are sending trustworthy information back to your software.
- Your software is only showing you the data that is being read around the areas where you placed your sensors. Remember there may be blind spots and microclimates. Consider placing sensors in critical or past problem areas. This also applies to the environment inside boxes or cases. Whatever is happening outside is not necessarily happening inside.
- The features of your software will be decided by the brand of sensor you use or by the service you hire. Be sure to know what you are buying and make sure it fits your specific needs. It is possible that the cheaper your sensor, the more basic your software will be. You should decide whether this is an acceptable trade-off based on your needs.
- Remember that graphs and tables are only as good as your interpretation of them. Don’t forget the critical thinking, human component. Software is just a tool to help you make better decisions. It should not be making decisions for you.
Environmental monitoring software should not be used as a substitute for professional judgment or expertise. It should be used as a complement or a support for environmental management. Collections care professionals should always verify and validate the data from environmental monitoring software with other sources of information, such as visual inspection, condition assessment, risk assessment, etc. They should also consult with other experts or specialists when necessary. Remember it is possible to hire consultants in preventive conservation to help you interpret your data.
Conclusions
We hope this article has helped you glean more information on the features and benefits of using environmental monitoring software as opposed to DIY Excel graphs, which should only really be used if your budget is so streamlined that you have absolutely no choice. And, in fact, If you find yourself in this kind of situation, we strongly recommend that you just use Conserv Cloud, which has a free version that allows you to upload .csv files from any data logger. You will not benefit from real-time alerts or remote monitoring capabilities, but you will definitely be able to ditch your manual graphs and save a lot of time that way – plus you will be able to see your data over time all in the same place without having to worry about your 10,000 spreadsheet rows.
If you have any questions about environmental monitoring, integrated pest management, or just want to talk about preventative conservation, please reach out to us! Don’t forget to check out our blog or join our community of collections care professionals where you can discuss hot topics, connect with your peers or even take a course to get familiar with the Conserv platform.


